Price Benchmarking In Procurement: Methods, Steps, KPIs
Build accurate bids with price benchmarking in procurement. Learn to analyze GeM and CPPP data, track KPIs, and create defensible estimates for contracts.
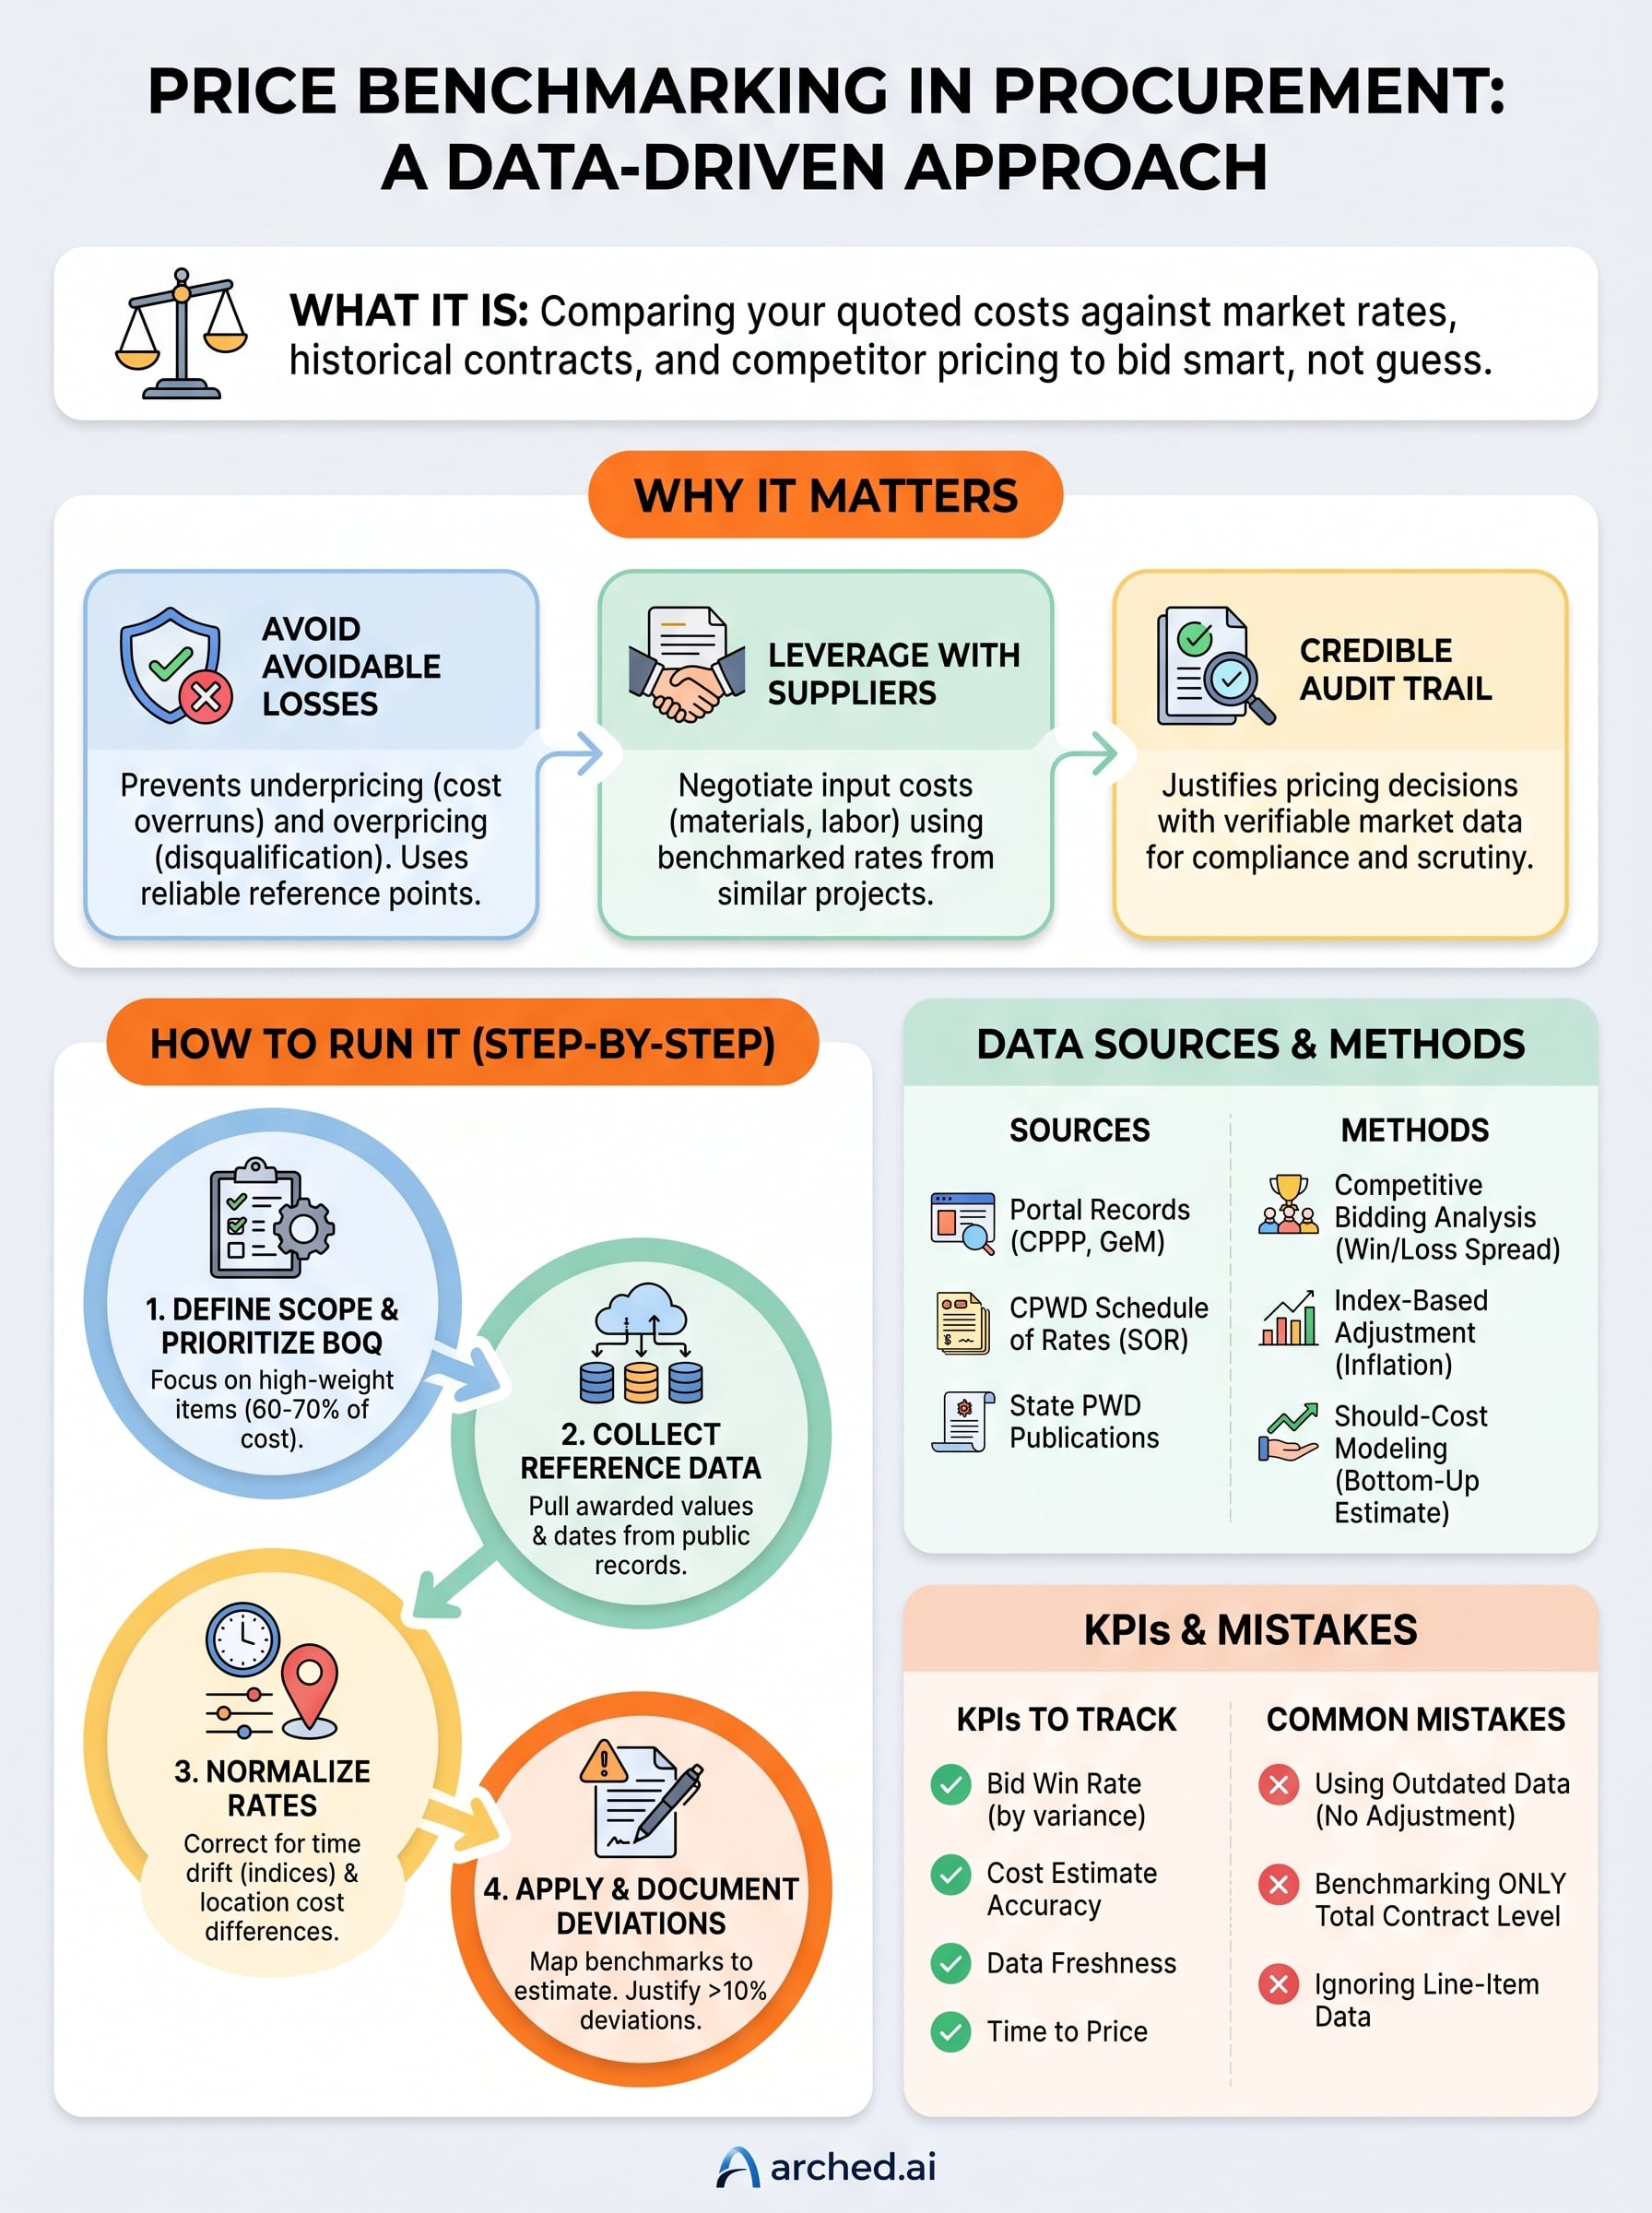
Every government tender your firm bids on comes down to a fundamental question: is your price competitive enough to win, yet realistic enough to deliver? Price benchmarking in procurement answers that question with data instead of guesswork. It's the process of comparing your quoted costs against market rates, historical contract values, and competitor pricing to determine whether you're bidding smart or leaving money on the table.
For infrastructure contractors and consultants operating across Indian public procurement portals, GeM, CPPP, state e-tender systems, the stakes are high. Contract values run into crores, margins are tight, and an uninformed estimate can cost you the bid or, worse, lock you into an unprofitable project. Without structured benchmarking, pricing decisions rely on intuition, and intuition doesn't scale across hundreds of BOQ line items in a single tender document.
This article breaks down what price benchmarking actually involves: the methods used in practice, the steps to build a repeatable process, and the KPIs that tell you whether it's working. At Arched, our platform parses tender documents and extracts BOQ data automatically, giving firms the raw material they need to benchmark faster. Here, we'll walk you through how to put that data to work.
Why price benchmarking matters in procurement
Price benchmarking in procurement does more than sharpen your bid estimates. It gives you a factual basis for every pricing decision you make, whether you're quoting a road rehabilitation project worth ₹50 crore or a smaller BOQ for urban drainage work. Without it, your pricing team works from memory, gut instinct, and stale data from the last project, none of which holds up in a competitive tender environment where multiple qualified firms are pitching for the same contract.
When your price deviates by even 5 to 8% from market rates, you either lose the bid outright or win a contract that bleeds your margins dry from day one.
It protects your bid from avoidable losses
Winning a tender at the wrong price is worse than not winning at all. Underpricing a BOQ item to beat competitors means you absorb cost overruns that were entirely predictable with proper benchmarking. Overpricing means your bid gets disqualified at the financial evaluation stage before your technical credentials even come into view. Both outcomes are avoidable when you have reliable price reference points drawn from actual awarded contracts in similar geographies, with comparable scope and specifications.
Portal records on CPPP and state e-procurement systems include historical awarded values that you can map directly against current tender BOQ items. When you use those records systematically, you stop anchoring your estimates to last year's rates and start using what the market has already validated through real contract awards.
It gives you leverage over suppliers and subcontractors
Your bid price is only as good as the input costs you negotiate from vendors, material suppliers, and subcontractors. Benchmarked rates for key cost drivers, like structural steel, RCC work, or earthmoving, give your procurement team a clear target to negotiate against. Without those benchmarks, vendors quote high because they know you lack the data to push back effectively.
Benchmarking shifts that dynamic. When you show a subcontractor what similar scope delivered for in comparable projects, you negotiate from evidence, not assumption. Over multiple bid cycles, this tightens input cost variance and makes your overall estimates more predictable and defensible.
It builds a credible audit trail for compliance
Government procurement in India carries real scrutiny. Tender evaluation committees and audit bodies review bid justifications, and an unexplained deviation from prevailing market rates draws questions quickly. When you maintain a documented benchmarking process, you create a record showing that your pricing was grounded in verifiable market data, not decided arbitrarily.
This matters especially for firms bidding on high-value contracts above ₹10 crore, where post-award audits are more frequent and thorough. A well-maintained benchmarking record demonstrates to evaluators that your rates are defensible, which reduces the risk of disputes, contract revision requests, or compliance complications after award. That protection alone justifies building a structured benchmarking process before your next submission.
How to run price benchmarking step by step
Running price benchmarking in procurement becomes manageable when you break it into discrete steps rather than treating it as a broad research exercise. A structured approach keeps your team consistent across multiple bids and produces outputs you can use directly in tender submissions without scrambling to justify your rates at the last moment.

Step 1: Define your scope and prioritize BOQ items
Start by identifying which BOQ line items carry the most weight in the tender. For a road widening project, that might be earthwork, granular sub-base, and bituminous surfacing. Trying to benchmark every line in a 200-item BOQ wastes time you don't have before submission deadlines. Focus on items that represent 60 to 70% of the estimated project cost first, then work outward to smaller-value items if time allows.
Step 2: Collect reference price data from awarded contracts
Pull awarded contract values from publicly available procurement records such as CPPP, state e-procurement portals, and GeM. Match each reference contract to tenders with comparable scope, geography, and specifications. Record both the awarded value and the contract date so you can account for price escalation when you apply older data to current tender rates.
The closer your reference contracts are in geography and scope to the current tender, the more reliable your benchmark becomes.
Step 3: Normalize rates before you compare them
Raw figures from different contracts don't compare directly without adjustment. Correct for time drift using published indices such as the CPWD Schedule of Rates updates, which reflect material and labor cost movements across regions. Also factor in location-specific cost differences, since earthmoving in hilly terrain costs meaningfully more than equivalent work on flat ground even when BOQ descriptions look identical.
Step 4: Apply benchmarks and document every deviation
Map your normalized benchmark rates against your internal estimate, line by line. Where your figure deviates by more than 10% from the benchmark, flag it for review rather than accepting it automatically. Document a clear rationale for each flagged deviation, whether it reflects unusual site conditions, specialized equipment, or a deliberate margin decision, so you can defend it to evaluators or auditors after the award.
What data to use in India public procurement
Effective price benchmarking in procurement depends on the quality of the data you feed into it. The Indian government's procurement ecosystem generates substantial publicly available pricing data across hundreds of portals, but knowing which sources are reliable and which are too inconsistent to use makes a real difference in the accuracy of your benchmarking output.
Portal records and awarded contract data
The most direct data source for benchmarking is awarded contract records published on portals like CPPP, GeM, and state e-procurement systems such as MSTC, IREPS, and various state PWD e-tender sites. These records disclose the awarded tender value, the number of bids received, and in many cases a BOQ-level breakdown. When you track these consistently across bid cycles, you build a reference dataset tied to actual market outcomes rather than estimated or theoretical rates.
The closer your reference contracts are in geography, scope, and recency to the current tender, the more reliable your benchmark becomes.
Here are the primary data sources you should pull from regularly:
- CPPP (Central Public Procurement Portal): Federal-level tender records with awarded values across sectors
- GeM (Government e-Marketplace): Rate contracts and catalog pricing for materials and services
- State e-procurement portals: Regionally specific rates that reflect local material and labor conditions
- MSTC and IREPS: Sector-specific portals covering materials and rail infrastructure contracts
CPWD Schedule of Rates and state PWD publications
The CPWD Schedule of Rates (SOR) is one of the most structured benchmarks available in Indian public procurement. Published annually by the Central Public Works Department, it provides standardized rates for labor, materials, and composite work items across major Indian cities. You can use SOR as a floor reference when checking whether your estimates align with government-recognized cost norms before a submission.
State PWD departments publish their own SOR equivalents, which often reflect local material costs and labor rates more accurately than national averages. For projects in Maharashtra, Karnataka, or Tamil Nadu, the respective state schedules give you more precise reference points than CPWD alone. Cross-referencing both sources lets you establish a benchmark range instead of anchoring to a single figure, which makes your pricing position far easier to defend during evaluation.
Methods and models to benchmark prices
No single method covers every scenario in price benchmarking in procurement. Different project types, data availability, and submission timelines call for different approaches, and the strongest benchmarking programs combine more than one model. Understanding what each method does well, and where it falls short, helps you pick the right tool for each tender you pursue.
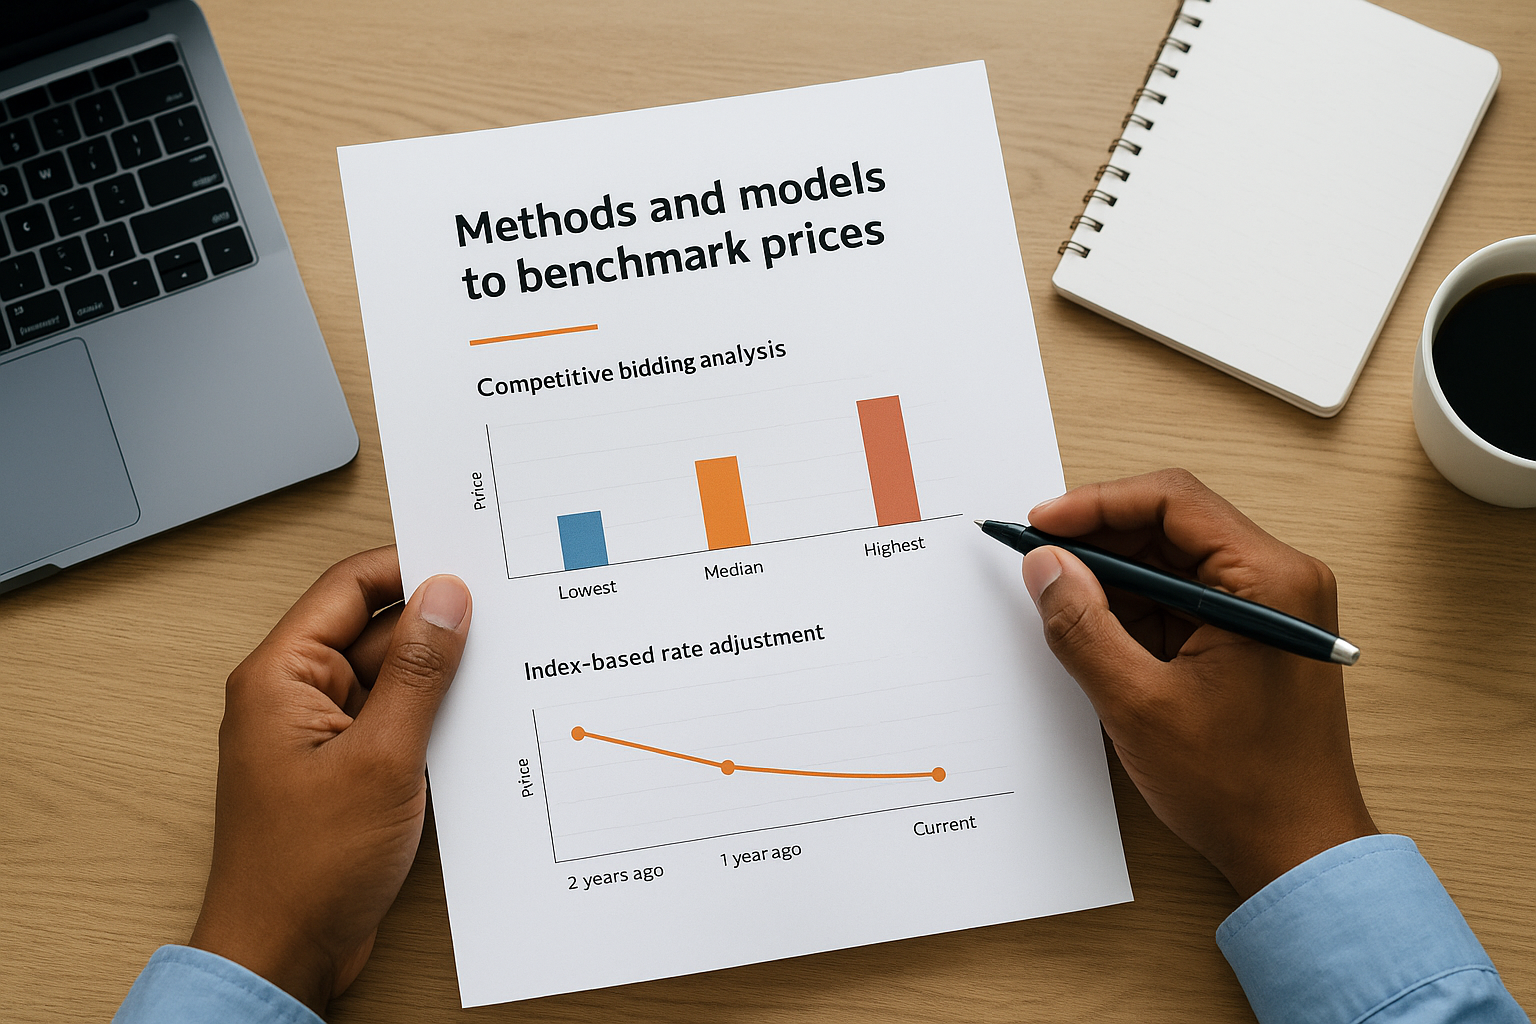
Competitive bidding analysis
Competitive bidding analysis compares the spread of prices submitted across previously awarded tenders that share scope and geography with your current target. By examining where the winning bid sat relative to the lowest, median, and highest submissions, you get a clear picture of what the market actually priced the work at when multiple qualified firms competed. This method works best when you have access to complete bid results, which Indian e-procurement portals publish after award.
Here is what to extract from each comparable bid record:
- Winning bid value and percentage below or above the engineer's estimate
- Number of participating bidders (more bidders means a sharper competitive signal)
- Spread between the lowest and the second-lowest bid
- Contract geography and project category
Index-based rate adjustment
Published price indices let you take historical contract data and bring it forward to current rates without guessing at inflation. The CPWD Schedule of Rates is updated periodically and reflects recognized cost movements in labor, cement, steel, and other core materials. When you apply an index-based adjustment to awarded contract values from two or three years ago, you preserve the relevance of older data rather than discarding it simply because it isn't recent.
Combining index-adjusted historical rates with current portal data gives you a benchmark range instead of a single point, which is far more defensible during evaluation.
Cross-referencing CPWD figures with state PWD schedules tightens your range further, since state publications capture local material and labor costs that national averages often miss.
Should-cost modeling
Should-cost modeling builds a price estimate from the bottom up by calculating what a project ought to cost based on inputs: labor hours, material quantities, and equipment utilization. Comparing your should-cost figure against actual market rates quickly reveals whether your internal assumptions align with what the market prices. When the two diverge by more than 10%, investigate the gap before you submit, not after.
KPIs to track and common mistakes to avoid
Measuring whether your price benchmarking in procurement process actually improves bid outcomes requires tracking specific metrics across bid cycles. Without defined KPIs, you have no way to tell whether your benchmarking effort is sharpening your win rate or simply adding workload to your team without producing better results.
KPIs that tell you benchmarking is working
Track these four metrics consistently to evaluate your process:
- Bid win rate by price variance band: The percentage of bids you win when your submitted price falls within 5% of your benchmark versus when it deviates further outside that range
- Cost estimate accuracy: The average gap between your submitted price and the final awarded contract value, measured over a rolling 6 to 12 month period
- Benchmark data freshness: The average age of reference contracts in your dataset, which should stay under 18 months for most Indian infrastructure categories
- Time to price: How long your team takes to produce a benchmarked estimate from initial BOQ extraction through to final submission, measured in hours per tender
If your win rate climbs when your price sits within 5% of your benchmark but drops sharply outside that band, your benchmarking process is producing a real signal worth acting on every submission cycle.
Mistakes that undermine your benchmarks
Using outdated reference data without adjustment is the most common error. A contract awarded three years ago, applied without an index correction, understates current input costs and sets your bid up to underprice the work. Always apply a recognized escalation index, such as CPWD Schedule of Rates updates, before pulling any historical rate into a live submission.
Benchmarking only at the total contract level rather than at the BOQ line-item level is a subtler problem that damages your accuracy just as badly. Two contracts can share an identical headline value while differing significantly in scope composition. When you compare totals only, you miss rate distortions buried inside individual work items. Drill into line-item data whenever portal records provide it, and reserve total-contract comparisons for early feasibility checks rather than final bid pricing decisions.
Next steps to put benchmarking to work
You now have a complete picture of what price benchmarking in procurement requires: the right data sources, a structured step-by-step process, proven methods, and measurable KPIs to track improvement across bid cycles. The gap between knowing this and applying it consistently comes down to building the process before the next deadline, not during it.
Start by pulling your last five submitted tenders and comparing your bid prices against awarded contract values from portal records for similar projects. That gap analysis tells you immediately whether your current estimates are running too high, too low, or within a defensible range. Once you see the pattern, you know where to tighten your process first.
For firms that want to move faster, Arched automates BOQ extraction and aggregates portal data across 500+ government procurement sources so your team benchmarks in hours instead of days. See what the platform does and cut your estimation cycle from the next bid forward.