What Is Procurement Analytics? Types, Methods, And Benefits
What is procurement analytics? Discover its types, methods, and benefits for Indian AEC firms. Use data to identify high-value tenders and boost win rates.
Every government contractor in India knows the grind: refreshing dozens of portals, sifting through hundreds of tenders, and trying to figure out which ones are actually worth pursuing. Behind the scenes, the firms that consistently win high-value contracts aren't just working harder, they're making smarter decisions with data. That's where procurement analytics comes in. It's the practice of collecting, analyzing, and acting on procurement data to improve spend visibility, supplier performance, and strategic decision-making across the sourcing cycle.
For companies in India's AEC sector, where a single infrastructure tender can run into hundreds of crores, the stakes of getting procurement decisions right are enormous. Yet most firms still rely on gut instinct and fragmented spreadsheets. Procurement analytics replaces guesswork with evidence, helping teams identify patterns in spending, spot risks in tender documents, and prioritize opportunities with the highest win probability. At Arched, we built our platform around this exact principle: using AI to analyze tender data across 500+ government portals so that contractors can focus on strategy instead of manual search.
This article breaks down what procurement analytics actually means, the different types you should know, the methods behind it, and the concrete benefits it delivers. Whether you're a bid manager evaluating tender pipelines or a BD lead trying to qualify for larger contracts, you'll walk away with a clear, practical understanding of how analytics can reshape your procurement process.
Why procurement analytics matters
The gap between firms that win consistently and those that chase every tender comes down to one thing: informed decision-making. Understanding what is procurement analytics means recognizing that it's not just about tracking spend, wait, no em dashes. Let me write this properly.
The gap between firms that win consistently and those that chase every tender comes down to one thing: informed decision-making. Understanding what is procurement analytics means recognizing that it's not just about tracking spend. It's about converting raw procurement data into a genuine strategic advantage. In India's public sector, where the GeM portal alone lists thousands of tenders at any given time, the volume of opportunity is not the problem. The problem is knowing which opportunities are worth pursuing and building a repeatable system for making that call faster and more accurately than your competitors do.
The cost of flying blind in government contracting
When your team manually checks portals, reads through lengthy PDF notices, and builds eligibility assessments from scratch, you're burning hours on work that structured data analysis can handle faster and more reliably. A single infrastructure tender can run to 200 pages of technical specifications, qualification criteria, BOQ clauses, and risk conditions. Miss one eligibility requirement and your bid gets disqualified outright. Miss a risk clause buried in the legal section and you take on a contract that costs more than it earns.
The firms that skip analytics don't just lose time. They lose margin on contracts they should never have bid for, and they miss contracts they were well-positioned to win because they ran out of bandwidth to evaluate them properly. Teams relying on keyword searches and spreadsheet tracking consistently report wasted bid effort across a large share of their submissions, effort spent on tenders where a basic data check would have revealed a disqualifying condition in minutes.
When you don't know where your effort is going, you can't control where your wins are coming from.
How data changes the bid/no-bid decision
The bid/no-bid decision is one of the most consequential choices a BD manager makes. Bid on the wrong tender and you drain resources from opportunities with a higher win probability. Pass on the right one and you hand that contract to a competitor who had better visibility. Analytics gives you the evidence to make that call with confidence rather than instinct, and it makes the process repeatable across your entire pipeline.
Specifically, procurement analytics maps your past project credentials, financial turnover history, and certifications against the current tender's eligibility requirements, flagging the contracts you qualify for and surfacing the gaps that would get your bid rejected. Instead of reading every tender document from scratch to understand your position, you work from a ranked shortlist built on actual eligibility data. That shift alone compresses what used to be a multi-day evaluation into something your team can action on the same morning.
Why the Indian public procurement landscape demands analytics
India's public procurement ecosystem is uniquely complex. You're dealing with hundreds of state-level e-procurement portals alongside national platforms like CPPP, GeM, IREPS, and MSTC, each operating on its own format, timeline, and documentation standard. Tracking opportunities across all of them manually is not a scalable approach for any serious contracting firm, regardless of how large your BD team is.
Beyond the volume, Indian government tenders carry sector-specific qualification thresholds that vary significantly across roads, bridges, irrigation, and urban infrastructure projects. A firm that qualifies comfortably for a PWD road project may fall short of NHAI corridor requirements entirely. Without analytics to map those distinctions against your credentials in real time, you're either over-bidding on contracts you can't win or under-bidding by missing tenders where you had a strong eligibility profile. Neither outcome is acceptable when contract values routinely run into tens or hundreds of crores.
What procurement analytics covers in practice
When people ask what is procurement analytics, they often expect a narrow answer about tracking purchase orders. In practice, procurement analytics spans the entire sourcing lifecycle, from initial opportunity discovery through contract execution and supplier performance review. It pulls data from multiple sources simultaneously, turning fragmented records into a structured picture of where your money goes, which suppliers perform reliably, and which contracts carry the most strategic value for your firm.
Spend analysis and supplier visibility
Spend analysis is the most foundational layer of procurement analytics. It maps every rupee your organization commits across categories, suppliers, and contract types so you can identify where you're getting value and where you're overpaying or duplicating effort. For a government contractor in India, this means tracking not just what you've spent on subcontractors and materials, but also which categories of work are producing the highest margins and which are dragging on your overall contract performance.
Supplier visibility goes one step further by giving you a live view of how each vendor is performing against delivery timelines, quality benchmarks, and compliance requirements. When you have that data consolidated in one place, you can make faster decisions about which suppliers to retain, which relationships need renegotiation, and which gaps in your supply chain could put an active contract at risk.
The firms with the strongest procurement data don't just react to supplier problems faster. They see them coming.
Contract performance and risk tracking
Beyond spend, procurement analytics tracks how active contracts are performing against their original scope, budget, and schedule. For AEC firms working on multi-year infrastructure projects, this matters enormously. A contract that looked profitable at the bid stage can deteriorate quickly if variation orders pile up, material costs shift, or milestone payments get delayed. Analytics surfaces those signals early so you can course-correct before a project turns into a loss.
Risk tracking extends this into the pre-award stage. Before your team commits to a bid, analytics can flag unusual clauses in tender documents, identify contracts where the qualification criteria are stricter than they appear on the surface, and compare the terms against your past project outcomes to estimate exposure. That level of structured review gives your bid managers a factual basis for the decisions they're already making on instinct.
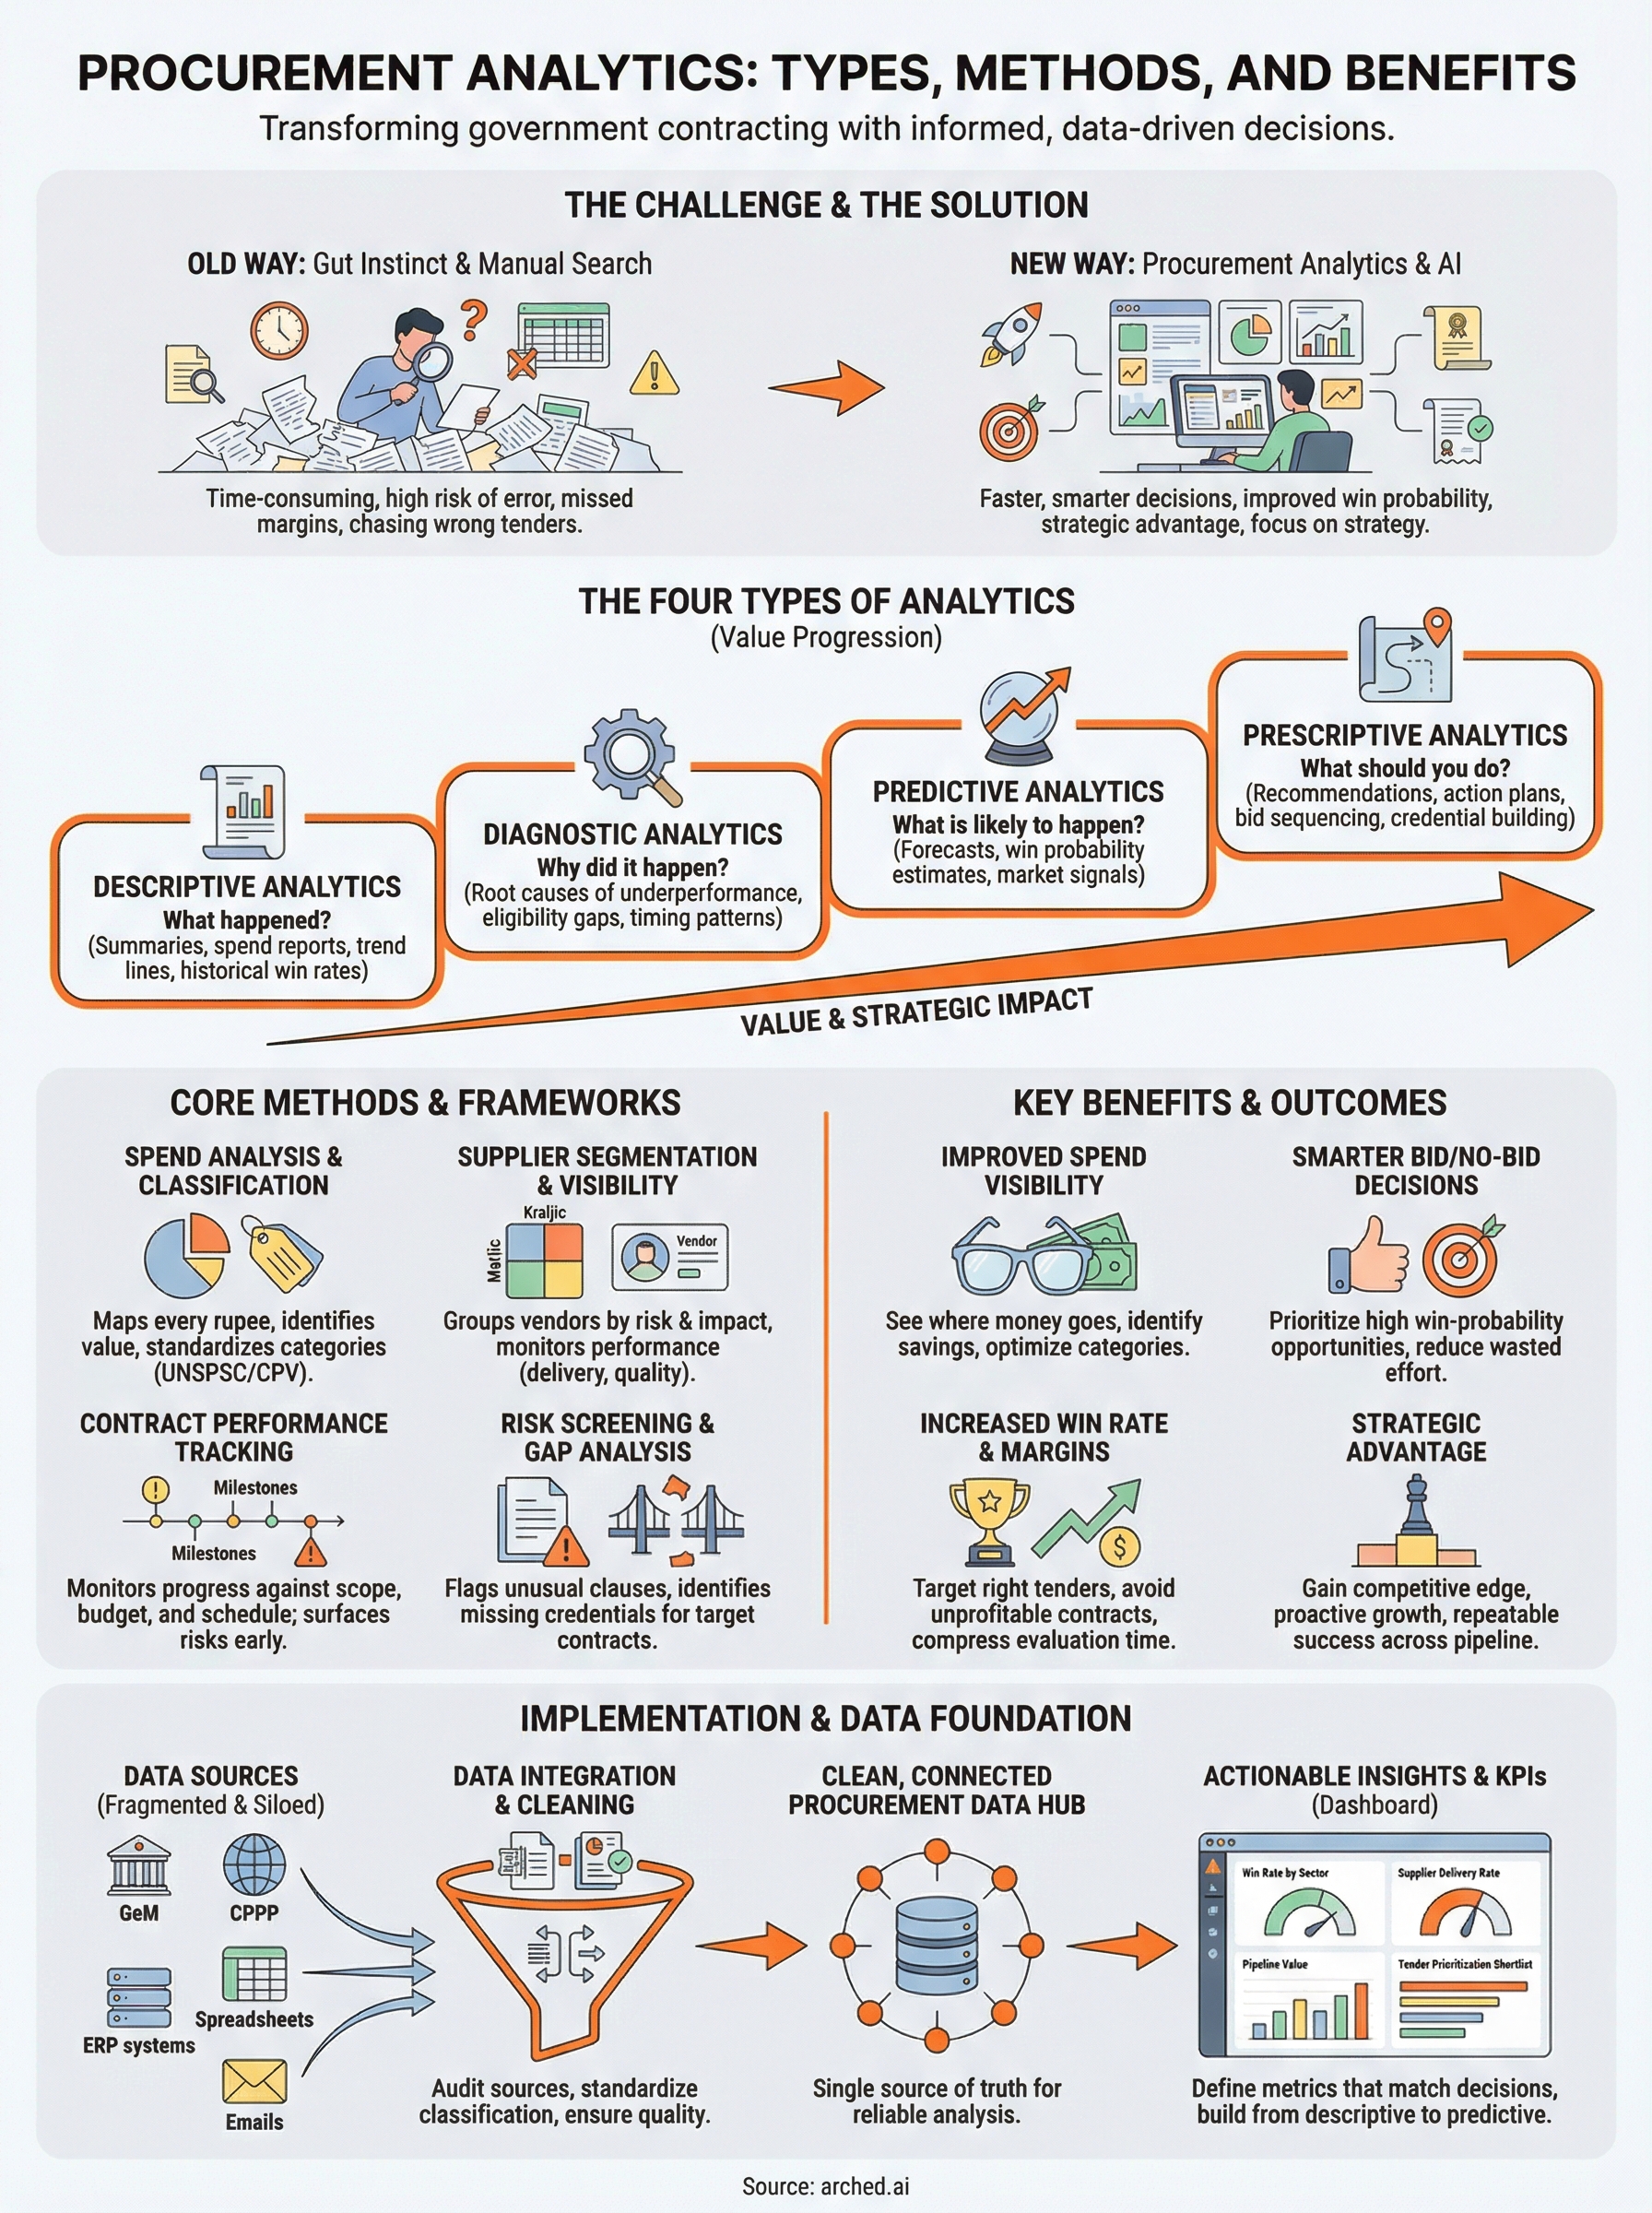
The four types of procurement analytics
When you break down what is procurement analytics into its component parts, the most useful framework is the four-type model that moves from looking at what happened to deciding what to do next. Each type builds on the previous one, and understanding where you sit on that spectrum tells you exactly which capability gap you need to close first.
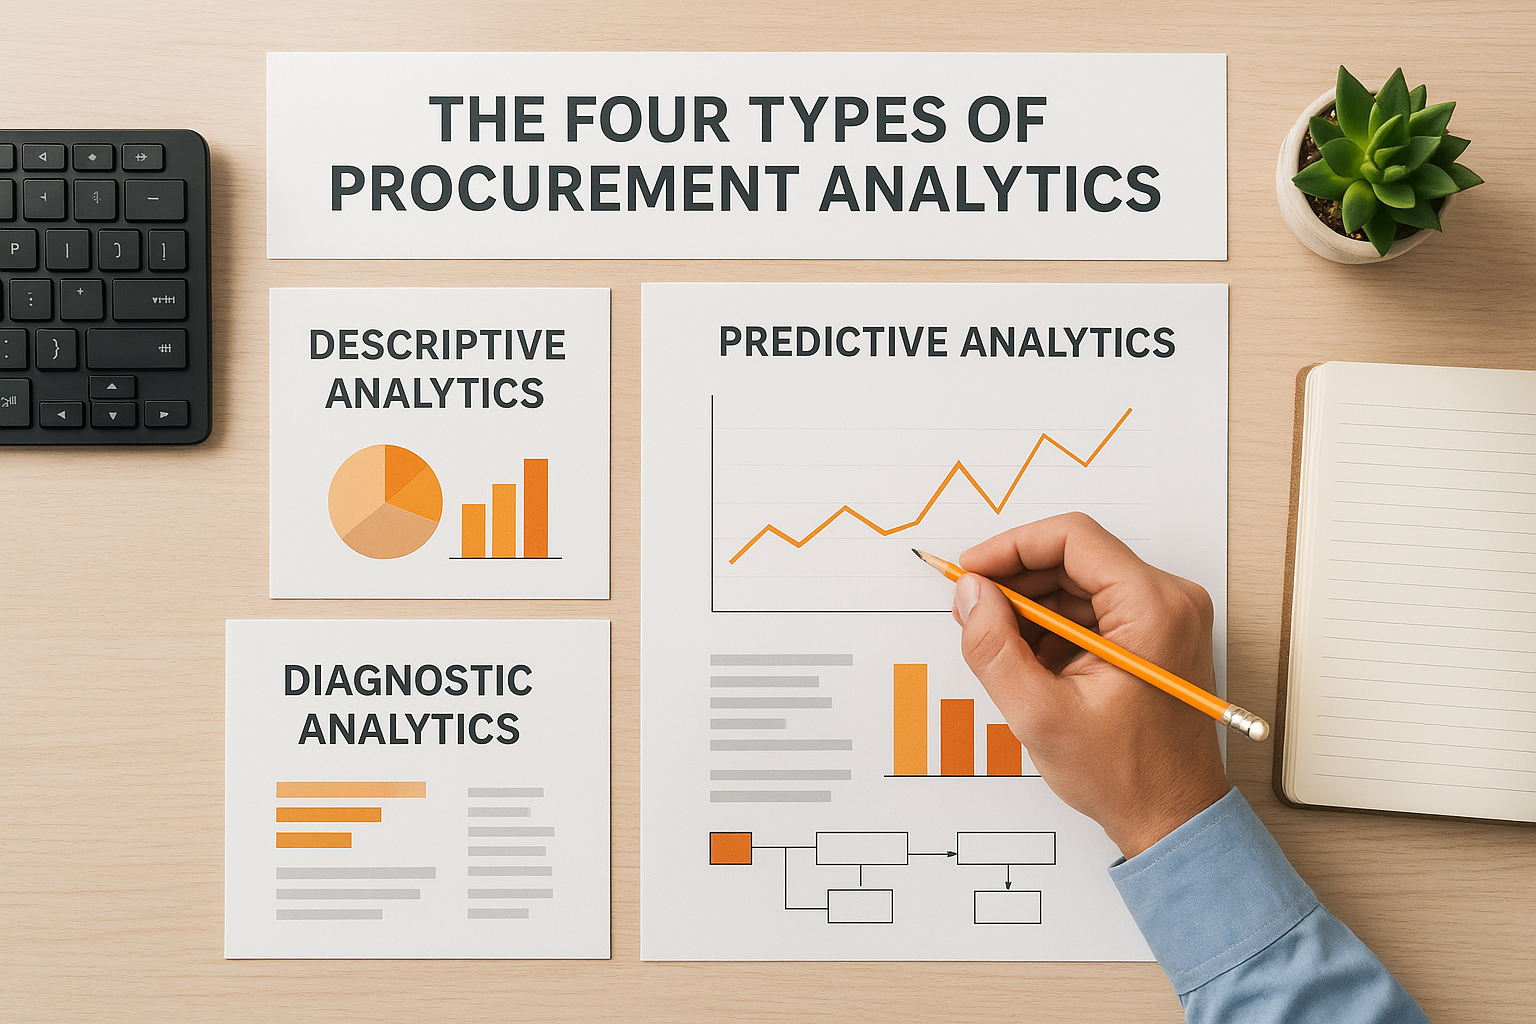
Descriptive analytics
Descriptive analytics answers the question: what happened? It pulls historical procurement data and organizes it into readable summaries, spend reports, and trend lines. For a contracting firm, this means knowing which tender categories you've bid on most frequently, what your historical win rate looks like across project types, and how your procurement budget has shifted over time. This layer is foundational but limited on its own because it only tells you what already occurred.
- Total tenders bid per quarter
- Win rate by sector or portal
- Spend distribution across supplier categories
Diagnostic analytics
Diagnostic analytics goes one step further and asks: why did it happen? Instead of just reporting that your win rate dropped in a given period, it traces that outcome back to specific causes such as eligibility gaps, late submissions, or pricing mismatches. Identifying the root cause of underperformance gives your BD team something concrete to fix rather than a trend to observe and forget.
- Eligibility failure reasons by tender category
- Submission timing patterns versus award outcomes
- Correlation between bid quality scores and win rate
Predictive analytics
Predictive analytics shifts the focus forward and asks: what is likely to happen next? It uses patterns in your historical data alongside market signals to forecast which tenders are likely to be released, estimate your probability of winning based on current credentials, and flag contracts worth prioritizing before the competition does. For infrastructure firms monitoring hundreds of portals, this is where analytics starts producing a genuine competitive edge.
Predictive analytics doesn't eliminate uncertainty. It gives you a structured basis for making decisions under uncertainty.
Prescriptive analytics
Prescriptive analytics answers the most valuable question: what should you do? It combines all the prior layers and recommends specific actions, such as which certifications to pursue, which stepping-stone contracts build your eligibility for a target tender, and how to sequence your bid pipeline to maximize pipeline value over the next 12 months. This is the type of analytics that separates a reactive BD function from one that actively shapes its own growth trajectory.
- Certifications to pursue for target contracts
- Stepping-stone projects to build missing eligibility credentials
- Bid pipeline sequencing recommendations by quarter
Core methods and frameworks to know
Knowing the types of analytics is one thing. Understanding what is procurement analytics at the method level gives you the tools to actually build a functional system. The methods below form the analytical backbone of most procurement operations, whether you're running a large infrastructure firm or a mid-size consultancy managing a handful of active tenders. Each method targets a specific layer of procurement data, and they produce the most value when you apply them together rather than treating each one as a standalone exercise.
Spend classification
Spend classification tags every procurement transaction against a standardized category structure so you can aggregate spend by type, supplier, and project. Without consistent classification, your spend data is a pile of line items with no structure. With it, you can identify concentration risk, find duplicate suppliers across business units, and understand which categories are costing more than they should.
Unclassified spend is invisible spend. You cannot optimize what you cannot see.
Common classification standards such as UNSPSC and CPV codes map procurement categories to a universal taxonomy, which makes benchmarking across time periods and business units far more consistent. Most firms start here because clean category data is the foundation for every other analysis you want to run.
Supplier segmentation
Supplier segmentation groups your vendor base by strategic importance and supply risk so you can allocate relationship management effort appropriately. The Kraljic Matrix is the most widely used framework for this, dividing suppliers into four quadrants based on category impact and supply market complexity. For AEC firms in India, this translates directly to understanding which subcontractors and material vendors carry the most execution risk on active infrastructure contracts and which ones you can manage efficiently at arm's length.
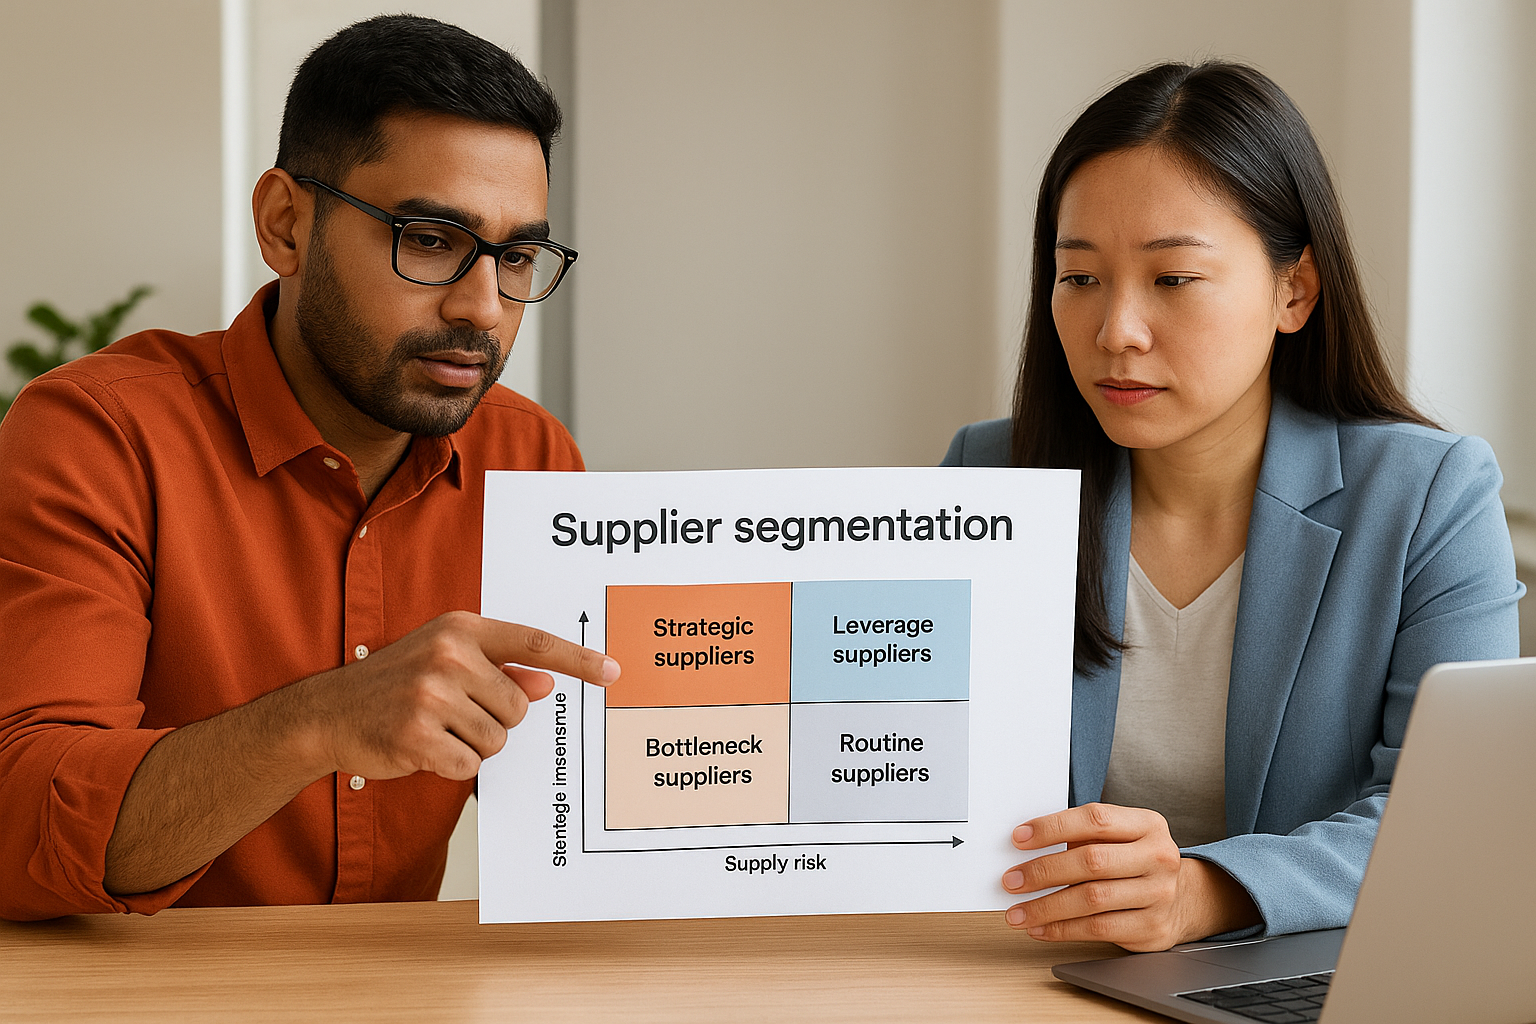
- Strategic suppliers: high impact, high risk, require active relationship management
- Leverage suppliers: high impact, low risk, suitable for competitive tendering
- Bottleneck suppliers: low impact, high risk, need contingency planning
- Routine suppliers: low impact, low risk, automate and simplify
Benchmarking and total cost of ownership
Benchmarking compares your procurement performance against historical baselines or sector norms to identify where you're paying more than you should or where your process efficiency lags behind what's achievable. Total cost of ownership (TCO) extends this by looking beyond the contract price to include delivery costs, compliance overhead, and risk exposure across the full contract lifecycle. Applied together, these two methods give you a realistic picture of what a supplier relationship actually costs your firm, not just what the invoice says.
For government contractors in India, TCO analysis is especially relevant on multi-year infrastructure projects. A vendor who bids lowest at award can become your most expensive relationship once you factor in delay penalties, rework, and compliance overhead tied to state-level procurement rules.
Procurement data sources and data quality
Understanding what is procurement analytics in full means recognizing that the quality of your analysis depends entirely on the quality of your data. Even the most sophisticated analytical methods produce misleading results if they're built on incomplete records, misclassified transactions, or data that's siloed across disconnected systems. Before you can extract reliable insights, you need to know exactly where your procurement data lives and whether it's clean enough to trust.
Where procurement data comes from
For government contractors in India, procurement data flows from a wide range of sources that rarely talk to each other by default. National platforms like GeM, CPPP, IREPS, and MSTC each maintain their own data formats and document standards. State-level e-procurement portals add another layer of variability. On top of that, your internal data sits across ERP systems, bid tracking spreadsheets, project accounting tools, and email threads that nobody has consolidated into a single record.

The most common sources your analytics system needs to pull from include:
- Government portals: GeM, CPPP, MSTC, IREPS, and state e-tender systems for live opportunity data
- Internal ERP and accounting systems: historical spend, supplier payments, and contract financial records
- CRM and bid management tools: win/loss history, bid effort logs, and submission timelines
- Document repositories: past tender PDFs, qualification certificates, and project completion records
The firms that win more don't always have more data. They have better-connected data.
Why data quality determines the value of your analysis
Poor data quality shows up in predictable ways: duplicate supplier records, unclassified spend categories, missing eligibility criteria from scanned documents, and tender records with no outcome logged. Each gap forces your team to fill in blanks manually, which reintroduces the same inefficiency that analytics is supposed to eliminate. Garbage in, garbage out is not a cliche here. It's the actual failure mode that undermines procurement analytics programs before they deliver results.
Fixing data quality is a prerequisite, not a follow-on task. That means standardizing how you classify tenders, establishing a consistent record-keeping protocol for bid outcomes, and ensuring your document parsing process captures structured data rather than just filing PDFs. When your data is clean, consistent, and connected across sources, every method and metric you layer on top of it produces insights you can actually act on rather than outputs you need to verify manually before trusting.
Procurement analytics metrics and KPIs
When you ask what is procurement analytics in operational terms, the answer comes down to what you measure. Metrics and KPIs translate your procurement data into a structured dashboard of signals that tell you whether your sourcing function is performing, improving, or losing ground to competitors who track the same numbers more carefully. Without defined KPIs, you have data but no reliable way to judge whether the patterns in that data are moving in the right direction.
The metrics you track determine the decisions you make. Choose them based on where your actual performance gaps are, not based on what is easiest to pull from your existing systems.
Spend and supplier performance metrics
Spend and supplier metrics give you a clear view of where your procurement budget is going and whether your vendor relationships are delivering the value they should. These numbers help you catch cost drift early, identify supplier concentration risk, and benchmark your performance against past periods.
Key spend and supplier KPIs to track:
- Spend under management: the percentage of total spend flowing through a formal procurement process
- Supplier on-time delivery rate: percentage of vendor deliveries meeting contracted timelines
- Maverick spend: procurement spend that bypasses your standard sourcing process
- Savings realized vs. target: actual cost savings achieved against your baseline forecast
- Supplier defect rate: frequency of quality failures per supplier across active contracts
Bid performance and pipeline KPIs
Bid performance metrics measure how effectively your team converts procurement intelligence into contract awards. For government contractors in India, these KPIs are especially critical because bid effort is expensive and every failed submission carries an opportunity cost you cannot recover elsewhere in your pipeline.
Your bid pipeline KPIs should cover both the efficiency of your tendering process and the quality of your eligibility targeting. Tracking these numbers over rolling quarters reveals patterns that a one-off review of individual bids would never surface, such as whether your win rate improves after you tighten eligibility screening or whether particular portal types consistently outperform others in your infrastructure category.
Key bid performance KPIs to track:
- Win rate by sector: percentage of bids awarded, broken down by infrastructure category
- Bid-to-win ratio: total bids submitted per contract awarded
- Eligibility disqualification rate: percentage of bids rejected for not meeting qualification thresholds
- Pipeline value: total value of active tenders under evaluation at any given point
- Time to submission: average days from tender discovery to bid lodgment
Common procurement analytics use cases
Part of understanding what is procurement analytics in real terms is seeing where it actually changes outcomes for teams doing the work. The use cases below aren't theoretical. They reflect the specific problems that BD managers, bid managers, and infrastructure consultants in India's AEC sector face week to week, and they show exactly how analytics addresses each one.
Tender opportunity prioritization
Your team cannot evaluate every tender that hits your dashboard with the same level of effort. Analytics gives you a ranked shortlist built on actual eligibility data rather than keyword matches or portal notifications. By mapping your firm's credentials, financial turnover history, and sector experience against each tender's qualification requirements, your system surfaces the contracts worth pursuing and filters out the ones that would waste your bid team's time.

Prioritization isn't about doing less. It's about concentrating effort where your win probability is highest.
This shift alone can compress a multi-day evaluation process into same-day decisions, freeing your BD team to focus on bid quality instead of manual screening.
Gap analysis and credential building
Not every high-value tender is reachable right now, but that doesn't mean it's permanently out of reach. Analytics identifies the specific credentials, certifications, or project experience your firm currently lacks to qualify for a target contract. From that gap, it can map out the stepping-stone projects you need to win first, giving your firm a structured growth pathway rather than a vague aspiration.
For firms targeting large NHAI or irrigation contracts, gap analysis turns long-term ambition into a sequenced action plan with measurable milestones. You know exactly what you need to build and in what order to build it.
Supplier risk management on active contracts
Analytics tracks vendor delivery rates, quality records, and compliance history across your active project portfolio so you can spot performance problems before they become contract liabilities. For infrastructure projects running over multiple years, a supplier who starts missing milestone deliveries in quarter two is a cash flow risk by quarter four. Catching that signal early gives you time to renegotiate, find alternatives, or escalate before the delay hits your payment schedule.
Contract risk screening before bid submission
Before your team commits resources to a bid, analytics can scan the tender document for unusual risk clauses, asymmetric penalty conditions, and qualification thresholds that are stricter than they appear on the surface. Reviewing those factors systematically across every tender in your pipeline protects your margin and prevents your firm from taking on contracts that are structurally unprofitable from the award date forward.
How to implement procurement analytics step by step
Understanding what is procurement analytics is only useful if you can translate it into a working system. Most implementation efforts fail not because the tools are wrong but because firms skip foundational steps and jump straight to dashboards built on incomplete or misclassified data. The steps below give you a practical sequence that builds a reliable analytics capability without wasting effort on layers your data isn't ready to support yet.
Audit your current data sources first
Before you configure any analytics tool, map every place your procurement data currently lives. That means your ERP system, bid tracking spreadsheets, tender portal accounts, email threads carrying supplier correspondence, and any project completion records stored as PDFs. Identifying gaps and format inconsistencies at this stage prevents you from building your metrics layer on top of data you later discover is incomplete. Log each source, note its format, and flag which records are missing outcome data you'll need for win rate and spend analysis.
You cannot build a reliable analytics system on data you haven't audited. Start there, not with the dashboard.
Define the metrics that match your actual decisions
Once you have a clear picture of your data landscape, select the KPIs that directly connect to the decisions your team makes most often. If bid/no-bid decisions are your biggest productivity drain, prioritize eligibility match rate and win rate by sector. If supplier performance on active contracts is your main risk, start with delivery rate and defect tracking. Trying to track every metric simultaneously dilutes focus and produces a dashboard that nobody refers to consistently.
Standardize classification before you build reports
Raw transaction and tender data needs a consistent classification structure before it produces meaningful analysis. Assign category codes to your spend records, standardize how you log bid outcomes, and establish a common naming convention for suppliers across your internal systems. This step is unglamorous but it determines whether your reports surface actionable patterns or just reflect the inconsistency in your source records. Spend classification and outcome tagging give every subsequent analysis a reliable foundation to build on.
Build from descriptive to predictive
Start with descriptive analytics to establish your baseline: win rates, spend distribution, and submission timelines across the past two to three years. Once those baselines are stable and your team trusts the numbers, layer in diagnostic analysis to identify root causes of underperformance. Predictive and prescriptive capabilities follow naturally once your historical data is clean, connected, and consistently categorized. Sequencing the build this way means each layer earns trust before the next one depends on it.
Where to go from here
Now that you understand what is procurement analytics and how it applies across spend visibility, supplier performance, bid prioritization, and contract risk, the next step is putting that knowledge to work on your actual pipeline. The firms that move first on better data consistently outperform those that recognize the gap but delay acting on it. Start by auditing your current data sources, define the two or three KPIs that connect directly to your biggest decisions, and build from there rather than trying to overhaul everything at once.
For contractors operating in India's AEC sector, the opportunity is immediate. Hundreds of crores in infrastructure contracts move through government portals every month, and the firms capturing them are the ones with the clearest picture of their eligibility and pipeline. If you want to see how AI-powered analytics can sharpen that picture for your team, explore the Arched platform and find out what you've been missing.