Tableau Procurement Analytics: How To Build Spend Dashboards
Learn to build spend dashboards with tableau procurement analytics. Track supplier risk, clean ERP data, and improve bidding for government tenders.
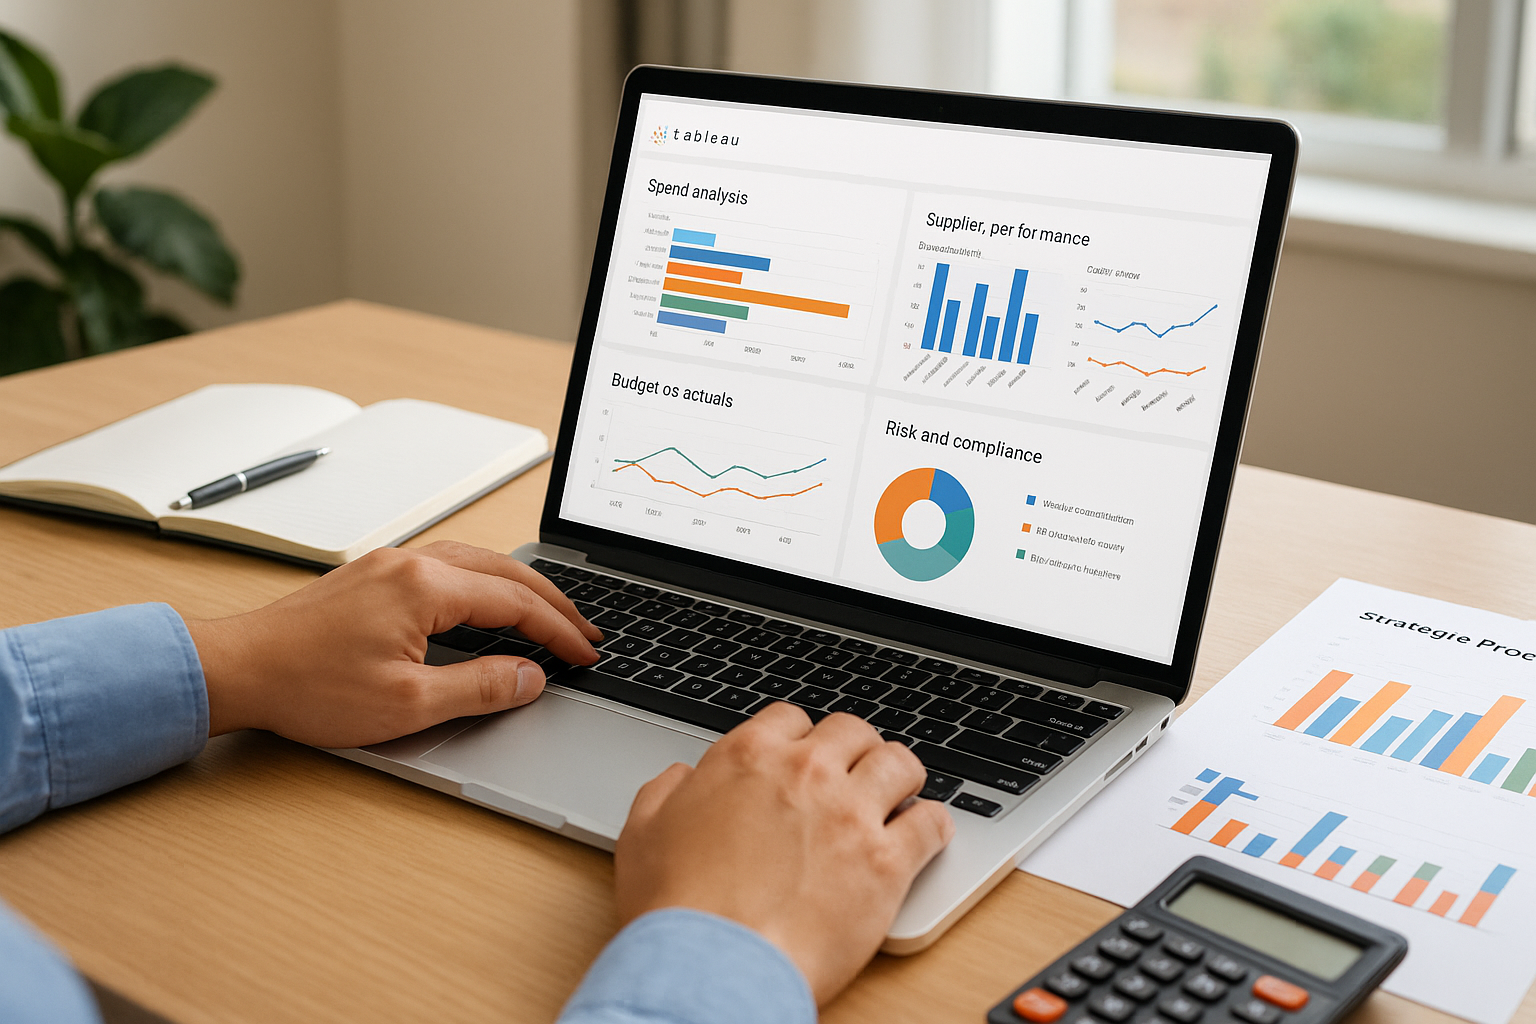
Most procurement teams in Indian infrastructure firms sit on mountains of spend data spread across GeM transactions, state e-procurement portals, and internal ERP systems. The problem isn't access, it's visibility. Without a clear way to slice that data, you end up making bid decisions based on gut feel instead of patterns. That's exactly where Tableau procurement analytics comes in: it turns scattered purchase records into dashboards that actually drive strategy.
Whether you're tracking vendor concentration, monitoring cost overruns on BOQ line items, or benchmarking spend across project categories, Tableau gives you the flexibility to build views tailored to how your firm operates. But a blank canvas can be intimidating. Knowing which charts to build, and which procurement KPIs deserve dashboard real estate, makes the difference between a pretty report and a decision-making tool.
At Arched, we process procurement intelligence from over 500 government portals to help AEC firms find and win contracts. We see firsthand how firms that understand their own spend patterns identify better opportunities and bid more competitively. This guide walks you through building Tableau procurement dashboards step by step, from connecting your data sources to designing views that give your BD and bid teams a genuine edge.
What procurement analytics in Tableau covers
Tableau procurement analytics is not a single dashboard type. It's a collection of interconnected views that together give you a complete picture of how your firm spends money, which vendors it relies on, and where procurement risk is building up. For Indian AEC firms bidding on government contracts, this matters because your historical spend patterns directly influence your eligibility for future tenders. GeM orders, state-level BOQ payments, and subcontract costs all tell a story. Tableau's job is to make that story readable, so your BD and bid teams can act on it rather than archive it.
The core use cases Tableau handles in procurement
Procurement analytics in Tableau covers four distinct problem areas that most infrastructure firms face simultaneously. Each area maps to a different stakeholder need.
| Use Case | What it answers | Who uses it |
|---|---|---|
| Spend analysis | Where money is going by category, vendor, and project | CFO, BD manager |
| Supplier performance | Delivery timelines, quality ratings, and contract compliance | Procurement head |
| Budget vs. actuals | Cost overruns on BOQ line items vs. estimates | Project manager |
| Risk and compliance | Vendor concentration, single-source spend, blacklisted suppliers | Legal, bid manager |
Each of these areas pulls from different data sources, which is why defining the scope upfront saves significant rework later in the build process.
How Tableau connects to procurement data sources
Your procurement data rarely lives in one place. ERP systems like SAP or Oracle hold purchase orders and vendor master data. GeM generates transaction records in CSV or API format. State e-procurement portals export bid history in PDF or Excel. Tableau connects to all of these through native connectors, Web Data Connector, or direct database connections, depending on where your data is stored.
If your procurement data exists in multiple formats across systems, consolidate it into a single data source, like a SQL database or a centralized Excel model, before connecting Tableau. Building dashboards on top of fragmented raw files creates maintenance debt that compounds quickly.
For AEC firms working across multiple state projects, you'll typically find data sitting in a mix of Tally exports, Excel trackers, and portal downloads. The practical starting point is a flat data table with these core columns: purchase order number, vendor name, vendor category, order date, delivery date, order value, project code, and payment status. Once you have that consolidated, Tableau can pull it in and you can start building meaningful views.
What separates Tableau from basic reporting tools
Most procurement teams start with Excel pivot tables or static PDF reports. Those work for looking backward. Tableau's core advantage is interactivity: you filter by vendor, date, or project and the entire dashboard updates in real time. That means when a bid manager asks "how much have we spent with this civil contractor across all projects in the last two years," the answer takes seconds, not a day of manual lookup.
Beyond speed, Tableau lets you layer multiple data sources in one view. You can show spend against budget on the same chart as delivery performance, so you immediately see if a vendor who runs cheap is also running late. For procurement decisions tied to government contract eligibility, that kind of multi-dimensional visibility is not a nice-to-have. It's the difference between informed bidding and guessing.
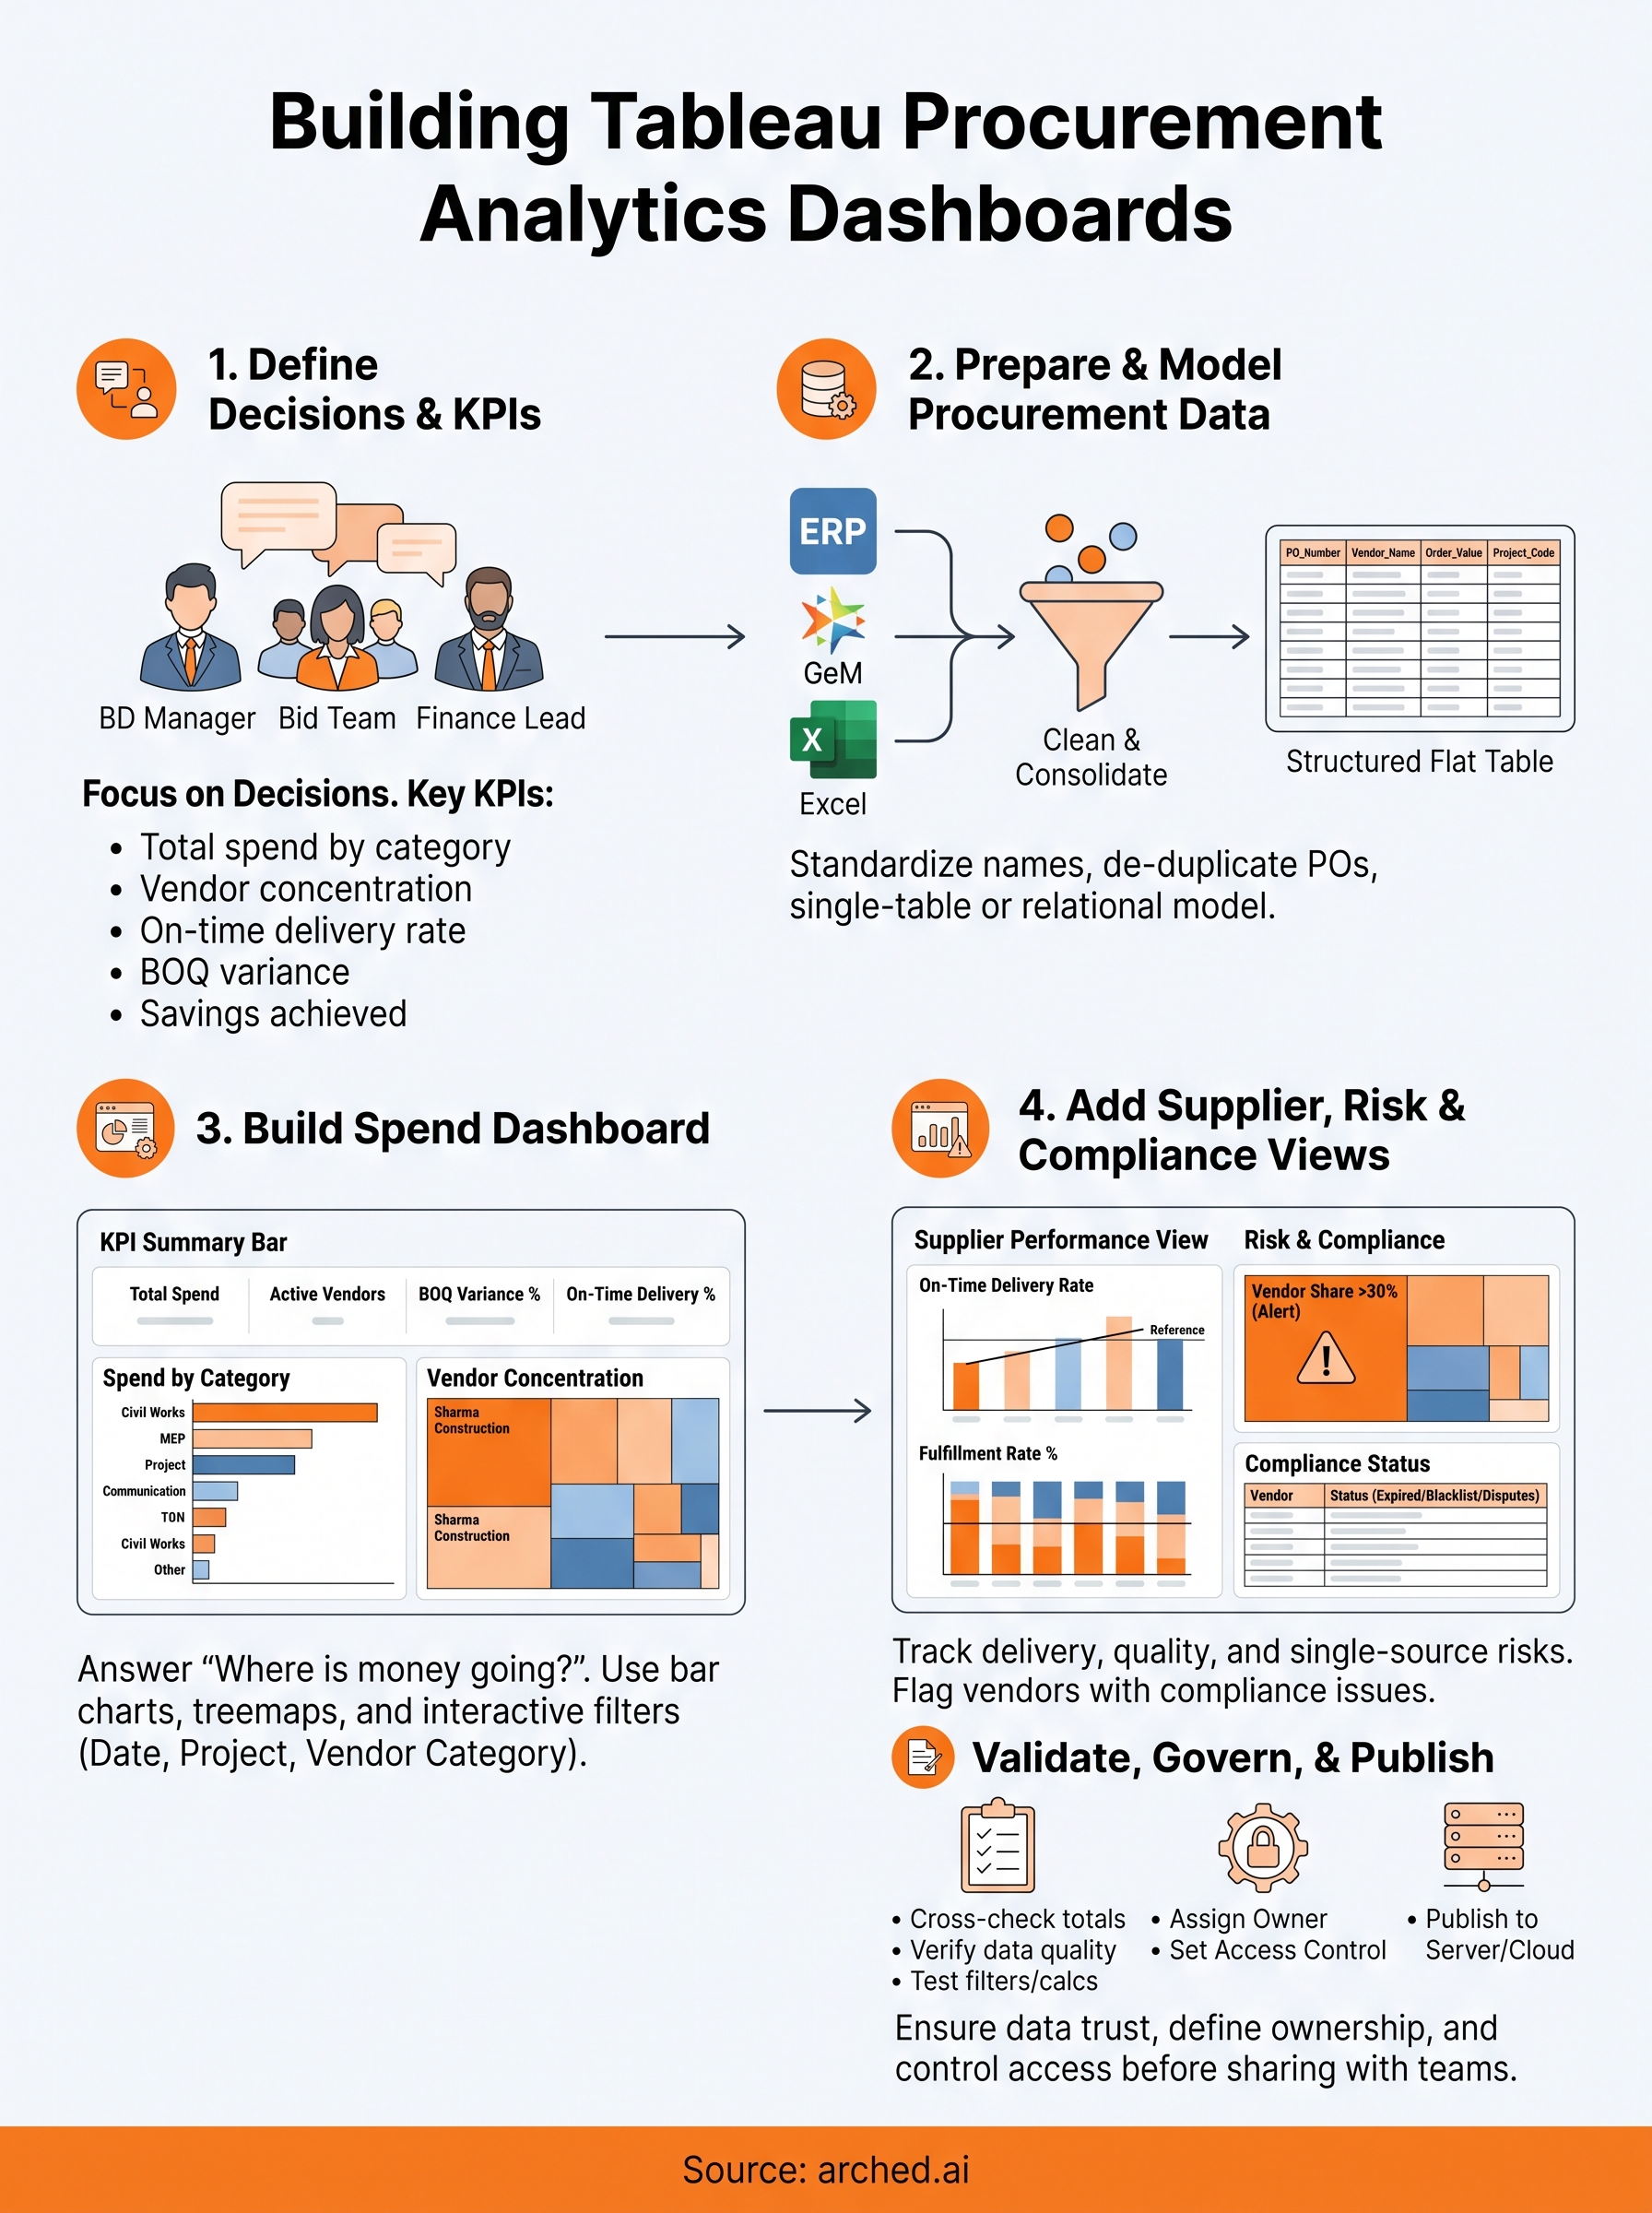
Step 1. Define decisions and KPIs for procurement
Before you touch Tableau, you need to know what questions your dashboards must answer. Skipping this step is the most common reason procurement dashboards end up unused: they show data without connecting it to the decisions your BD managers, bid teams, or finance leads actually make. For government contracting in the AEC sector, those decisions are specific. Which vendors can support a large civil contract? Where is your spend concentrated enough to create supply risk? Which BOQ categories are running over estimate?
Choose KPIs that map to real decisions
Every KPI you put on a dashboard should trace back to a decision someone on your team makes regularly. If nobody acts on a metric, remove it. For tableau procurement analytics to work in practice, your KPI list needs to stay tight and decision-linked. Here are the core KPIs that matter for Indian AEC firms bidding on government contracts:
| KPI | What it measures | Decision it supports |
|---|---|---|
| Total spend by category | Spend across civil, MEP, and other work types | Budget allocation and bid pricing |
| Vendor concentration ratio | % of spend going to top 3 to 5 vendors | Supply chain risk assessment |
| On-time delivery rate | % of orders received on agreed dates | Vendor eligibility for future tenders |
| BOQ variance | Actual vs. estimated costs per line item | Bid accuracy and margin protection |
| Savings achieved | Negotiated savings vs. benchmark prices | Procurement team performance tracking |
Pick no more than eight KPIs for your first dashboard. A focused view your team uses daily beats a comprehensive one they ignore.
Set the scope before you open Tableau
Once you have your KPIs, define the time range and project scope your dashboard will cover. For most AEC firms, a rolling 24-month window gives you enough data to spot trends without pulling in outdated vendor relationships that no longer reflect current operations. Decide whether you are building a firm-wide view or a project-level view first, because that choice determines how you structure your data model in the next step. Write both decisions down in a short brief before you start building. Your brief becomes the reference point when stakeholders ask why certain metrics appear or are missing from the final dashboard.
Step 2. Prepare and model procurement data
Clean, structured data is what separates a functional Tableau procurement analytics dashboard from one that produces misleading numbers. Before you connect Tableau to anything, your procurement data needs to be consolidated, de-duplicated, and structured in a format that supports the KPIs you defined in Step 1. Skipping data preparation creates errors downstream that are difficult to trace once your dashboard is live and being used by bid teams.
Clean and consolidate your data sources
Your first task is pulling all procurement records into a single flat table. If you export from multiple sources such as GeM, ERP, and Excel trackers, you will likely find inconsistent vendor names, mismatched date formats, and duplicate order entries. Standardize vendor names before you do anything else. A vendor appearing as "Sharma Constructions," "Sharma Const.," and "Sharma Construction Ltd" in the same dataset will break your vendor concentration calculations.
Run a de-duplication check on purchase order numbers first. Duplicate POs are the most common data error in procurement exports and they silently inflate spend totals.
Use this column structure as your baseline flat table template:
| Column Name | Format | Example Value |
|---|---|---|
| PO_Number | Text | PO-2024-00412 |
| Vendor_Name | Text (standardized) | Sharma Construction Ltd |
| Vendor_Category | Text | Civil Works |
| Order_Date | Date (YYYY-MM-DD) | 2024-03-15 |
| Delivery_Date | Date (YYYY-MM-DD) | 2024-04-10 |
| Order_Value_INR | Number | 4200000 |
| Project_Code | Text | PROJ-BNG-07 |
| BOQ_Category | Text | Earthworks |
| Payment_Status | Text | Paid |
Structure your data model for Tableau
Once your flat table is clean, decide whether Tableau will use a single-table connection or a relational model. For most AEC firms starting out, a single consolidated table works well through the first few dashboards. If you later need to join vendor master data or project budget tables, Tableau's relationship feature in the data source pane handles that without requiring SQL joins.
Save your consolidated table as a SQL view or a named Excel file with a fixed schema. Avoid connecting Tableau directly to raw portal exports because their column structures change without warning. A stable, version-controlled data source keeps your dashboards reliable when procurement records update each month.
Step 3. Build a spend dashboard that answers questions
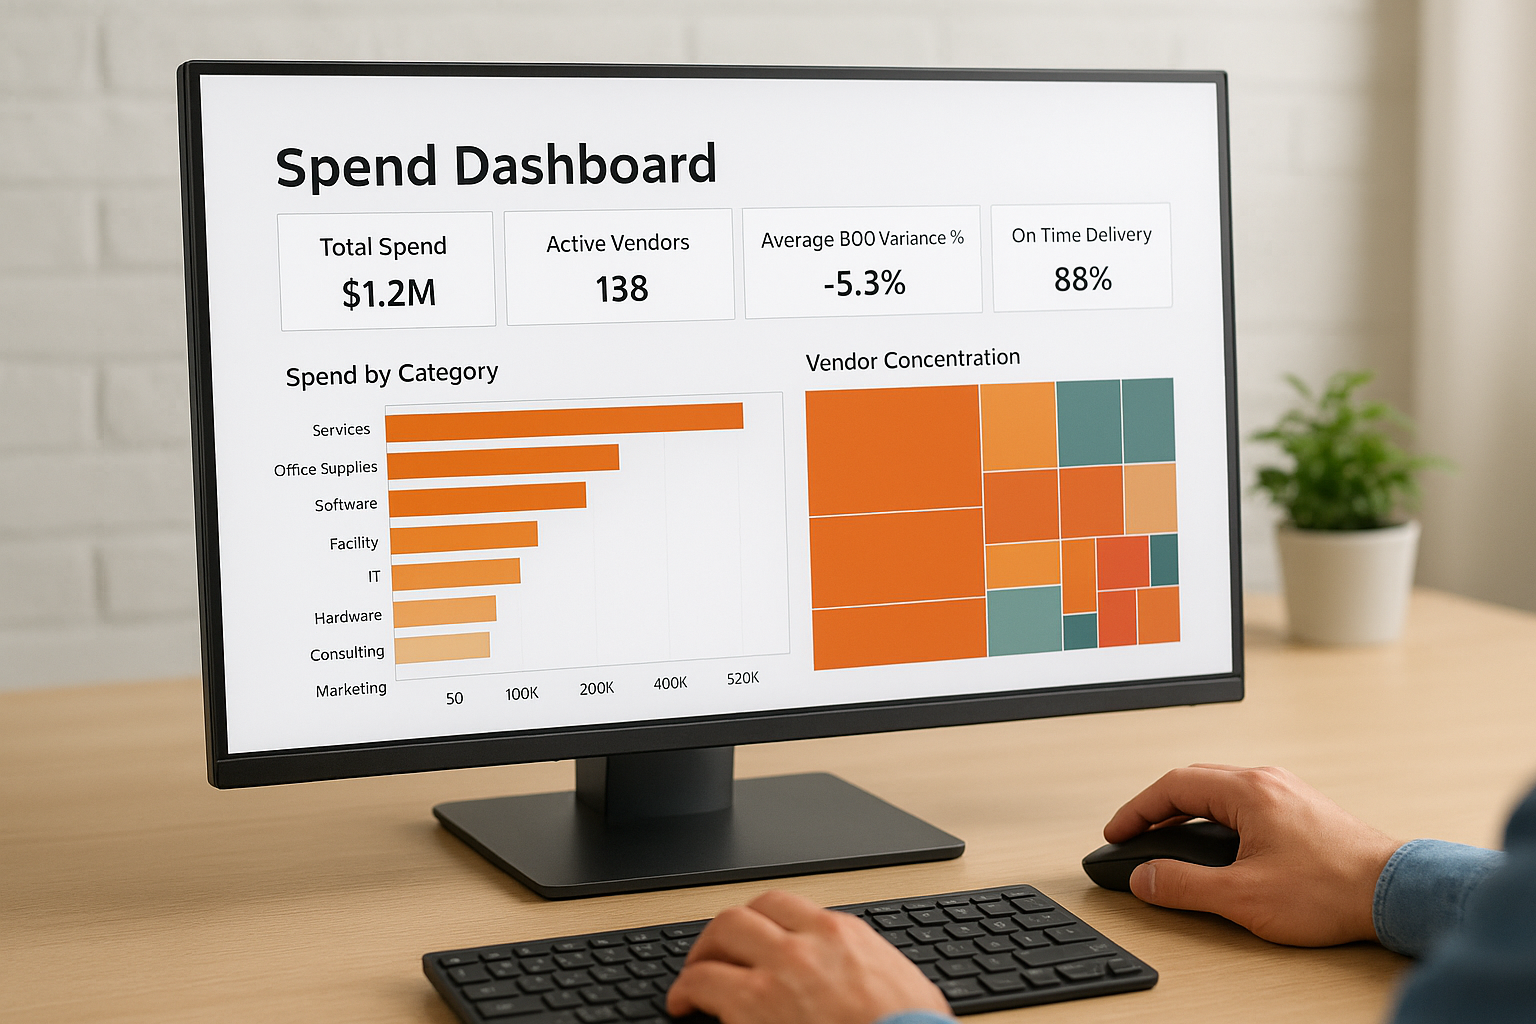
With your data model ready, open Tableau Desktop and connect to your consolidated procurement table. Your first dashboard should answer one primary question: where is your firm's money going? Keep the initial build focused on spend by category and vendor, and resist adding complexity until those core views are working correctly.
Choose the right charts for each KPI
Your chart choices determine whether your team reads the dashboard or ignores it. For total spend by category, use a horizontal bar chart sorted descending, so the largest spend categories appear at the top without requiring anyone to search. For vendor concentration, a treemap works well because it shows proportional spend visually at a glance. Set both charts to use the same color palette tied to your project code dimension, so patterns carry across views without requiring a legend lookup each time.
Build each chart to answer exactly one question. If a chart needs a paragraph of explanation to interpret, rebuild it.
Add a KPI summary bar at the top of your dashboard with four calculated fields: total spend, number of active vendors, average BOQ variance percentage, and on-time delivery rate. In Tableau, create these as calculated fields using formulas like the following:
// BOQ Variance %
(SUM([Order_Value_INR]) - SUM([BOQ_Estimate_INR])) / SUM([BOQ_Estimate_INR]) * 100
This gives your BD manager a single-line summary before they drill into any chart below it.
Set up filters that match how your team works
Filters make your tableau procurement analytics dashboard interactive rather than static. Add three filters to your spend dashboard: date range, project code, and vendor category. Place them in the top-right panel using Tableau's filter shelf, and set each to "Apply to all worksheets using this data source" so one selection updates every chart simultaneously.
For the date range filter, use a relative date filter set to the last 24 months as your default. This keeps the view current without requiring manual updates each month. Lock the project code filter to show only active projects by creating a calculated field that flags closed projects, then excluding them from the filter list at the data source level.
Step 4. Add supplier, risk, and compliance views
Your spend dashboard shows where money is going, but it doesn't tell you whether your suppliers are reliable or whether your procurement practices create compliance exposure. Those questions matter critically for government contracting in India, where a vendor's past performance and your firm's single-source spend patterns can directly affect bid eligibility and tender scoring. This step adds two additional views to your Tableau procurement analytics setup: one focused on supplier performance and one focused on risk and compliance signals.
Build a supplier performance view
Create a new Tableau worksheet and connect it to the same consolidated data source you built in Step 2. Your supplier performance view needs three core metrics plotted side by side: on-time delivery rate, order fulfillment value versus contracted value, and number of disputed invoices per vendor. Use a horizontal bar chart for on-time delivery rate, sorted descending so your most reliable vendors appear at the top. Add a reference line at 85% to flag underperforming vendors visually without requiring anyone to manually scan the numbers.
For the fulfillment rate, use this calculated field in Tableau:
// Fulfillment Rate %
SUM([Delivered_Value_INR]) / SUM([Order_Value_INR]) * 100
Place this as a color-encoded column next to vendor names, using a red-to-green diverging palette so gaps stand out immediately. Add a filter for vendor category so procurement leads can isolate civil contractors, MEP suppliers, or consultants independently.
Track risk and compliance exposure
Vendor concentration is the most common procurement risk that firms underestimate until a key supplier drops out mid-project. Build a concentration risk view using a treemap showing each vendor's share of total spend. If any single vendor exceeds 30% of total spend in a category, that block should stand out clearly.
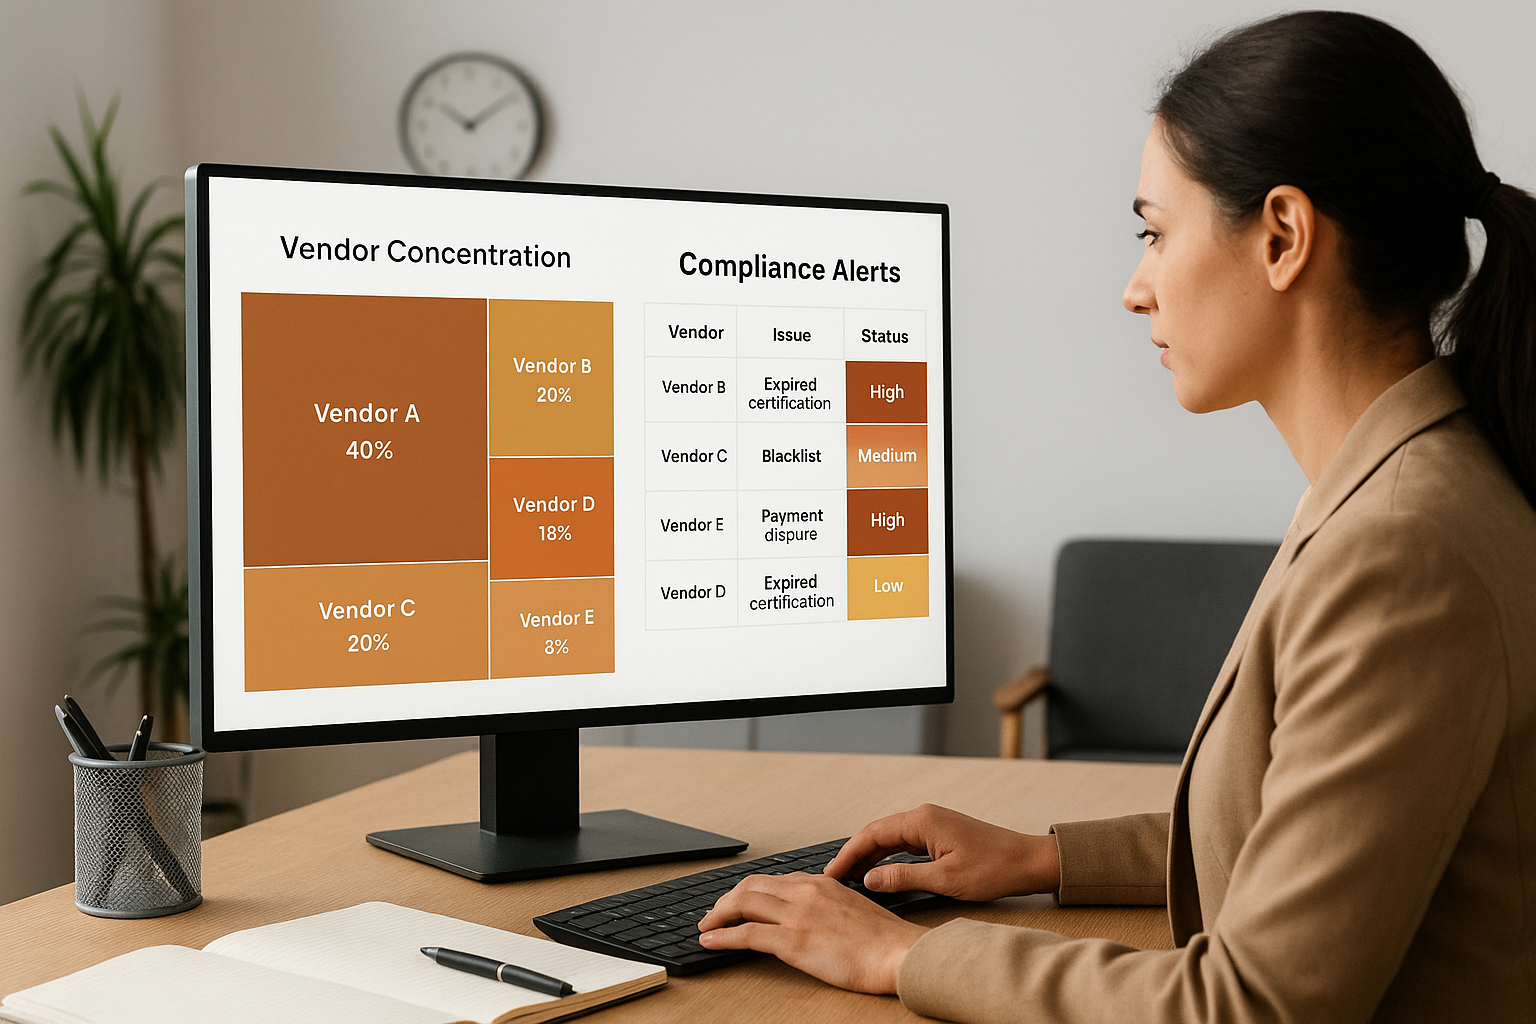
Flag any vendor whose share exceeds 30% of category spend with a calculated alert field, so your bid manager sees the risk before committing to a tender that depends on that supplier.
Add a separate compliance table below the treemap listing vendors with expired certifications, blacklist status, or payment disputes. Pull this from your vendor master data and join it to your main table using the Vendor_Name field. This combined view gives your legal and bid teams a single reference point before finalizing any subcontractor list for a government tender submission.
Step 5. Validate, govern, and publish for teams
A dashboard that contains errors is worse than no dashboard at all because it creates false confidence in bid decisions. Before you publish your tableau procurement analytics views to your BD and bid teams, you need to run a structured validation pass and set up governance rules that keep the data trustworthy over time.
Validate your data before sharing
Your first validation step is cross-checking your dashboard totals against a known source. Pull a total spend figure directly from your ERP or accounting system for a single quarter, then verify that your Tableau spend dashboard shows the same number for the same period. If the numbers differ, trace the gap to your data preparation step and fix it at the source, not inside Tableau.
Run this five-point checklist before publishing any procurement view:
- Verify total spend matches your accounting system for at least one quarter
- Confirm vendor names are fully standardized with no duplicates appearing as separate rows
- Check that date filters return the correct record counts at both boundaries of your selected range
- Validate that calculated fields like BOQ variance and fulfillment rate return expected results on a sample of ten known purchase orders
- Confirm that null values in optional fields do not distort KPI totals
Fix data errors at the source table, not inside Tableau calculated fields. Patching upstream problems with workaround formulas makes your dashboard fragile and difficult to maintain.
Set governance rules for dashboard ownership
Every published dashboard needs a named owner who is responsible for monthly data refreshes and responds when team members flag data discrepancies. Assign ownership before you publish, and document it in a brief governance log that records the owner's name, refresh schedule, and the data source version the dashboard connects to.
Access control is equally important for procurement data. In Tableau Server or Tableau Cloud, set row-level permissions so project managers see only their own project spend while BD leads see the firm-wide view. Use Tableau's built-in user filter to apply this without duplicating workbooks.
Publish and control access in Tableau Server or Cloud
To publish, navigate to Server > Publish Workbook in Tableau Desktop, select your target project folder, and set the refresh schedule to match how frequently your procurement data updates, typically weekly for active projects. Embed the dashboard link in your team's internal project management tool so BD managers access it without logging into Tableau separately each time.
Next steps for your dashboards
You now have a working blueprint for tableau procurement analytics that covers spend analysis, supplier performance, risk tracking, and governance. The next step is not to build more dashboards but to put what you have in front of your BD and bid teams and collect feedback after the first two weekly reviews. Real use surfaces gaps faster than any planning session.
Once your team is working from live dashboards regularly, expand your data model to include tender bid history so you can correlate past spend with win rates on specific BOQ categories. That connection turns procurement data into a competitive intelligence tool, not just a cost tracker.
Your spend patterns also reveal eligibility gaps for high-value government contracts. Arched's procurement intelligence platform maps your firm's credentials and project history directly to viable tender opportunities, so your dashboards and your bidding strategy work together. Explore what Arched can do for your firm to see how it fits your workflow.