Bridge Life Cycle Cost Analysis: Methods, Models, Tools
Use bridge life cycle cost analysis to justify your bid's long-term value. Explore models and tools used to win NHAI and MoRTH infrastructure projects.
Bridge Life Cycle Cost Analysis: Methods, Models, Tools
Every bridge built in India carries two price tags. The first is the construction cost, the number in your bid. The second is the bridge life cycle cost analysis figure: the total of design, construction, inspection, maintenance, rehabilitation, and eventual demolition spread across 50 to 100 years of service life. Indian highway authorities, NHAI, MoRTH, state PWDs, are paying closer attention to that second number. Tenders increasingly reference durability-based design specifications and whole-life costing criteria, particularly for major river crossings, viaducts, and structures in corrosive or seismic environments.
For contractors bidding on these projects, understanding BLCCA isn't optional anymore. It shapes material choices, design alternatives, and the technical approach you present in your bid. A contractor who can demonstrate life cycle cost awareness, choosing UHPC deck joints over conventional expansion joints, for example, builds a stronger technical submission. At Arched, where we help infrastructure contractors find and qualify for bridge tenders across every major Indian procurement portal, we see this shift reflected in NIT requirements and evaluation criteria with growing frequency.
This article breaks down BLCCA methods, the models agencies and consultants use, the software tools available, and how this analysis connects to the bridge tenders you're actually bidding on.
Why bridge life cycle cost analysis matters
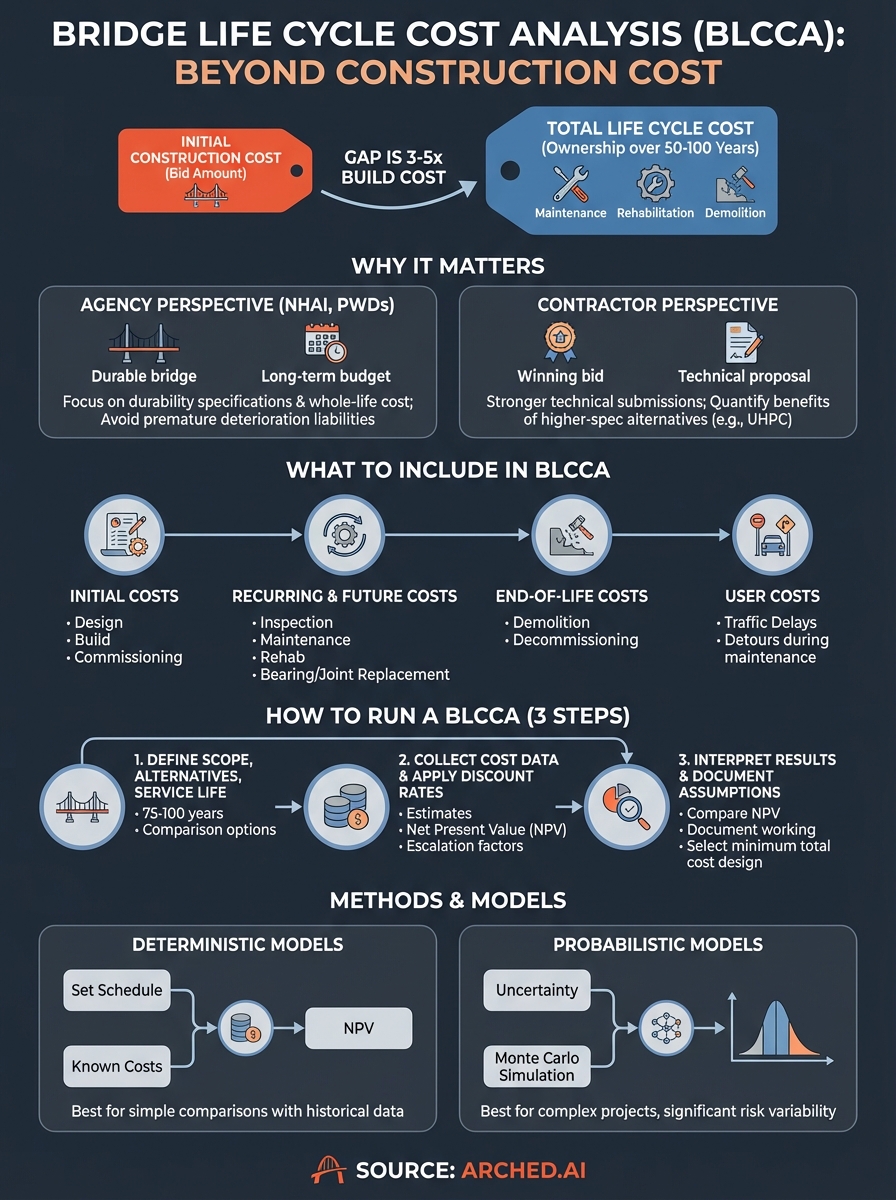
Most contractors price a bridge project by adding up materials, labor, equipment, and overhead. That calculation wins or loses the bid, so it gets all the attention. What it misses is the total ownership cost that the asset owner, whether NHAI, a state PWD, or an urban body, will carry across the structure's full service life. A bridge life cycle cost analysis captures that full picture, and the gap between initial construction cost and total life cycle cost is typically three to five times the build cost for major infrastructure.
Why agencies are demanding whole-life cost visibility
Indian highway authorities have spent decades dealing with the downstream consequences of decisions made purely on lowest initial bid. Premature deck deterioration, bearing replacements after 15 years instead of 40, expansion joints that fail in the first monsoon cycle: these are budget problems that appear long after the contractor has left site. NHAI's shift toward durability specifications and MoRTH's updated bridge maintenance guidelines reflect a direct response to this pattern.
When an agency evaluates two technically similar bids, the one that demonstrates lower long-term maintenance liability carries a real scoring advantage under whole-life cost evaluation criteria.
What this means for your bid strategy
Understanding BLCCA changes how you present technical alternatives. If you propose a UHPC deck panel system with a 60-year maintenance-free window instead of a conventional reinforced concrete deck, you need to back that claim with life cycle cost numbers, not just product specifications. Agencies expect contractors to quantify the claim. Your technical submission becomes stronger when it shows that the premium on a higher-spec material pays back within the first major maintenance cycle, because that is the language asset owners now evaluate against.
What to include in a bridge LCCA
A complete bridge life cycle cost analysis covers every cost phase the structure will pass through, not just the items in your construction budget. Getting the scope right matters because missing a cost category produces a misleading comparison between design alternatives.
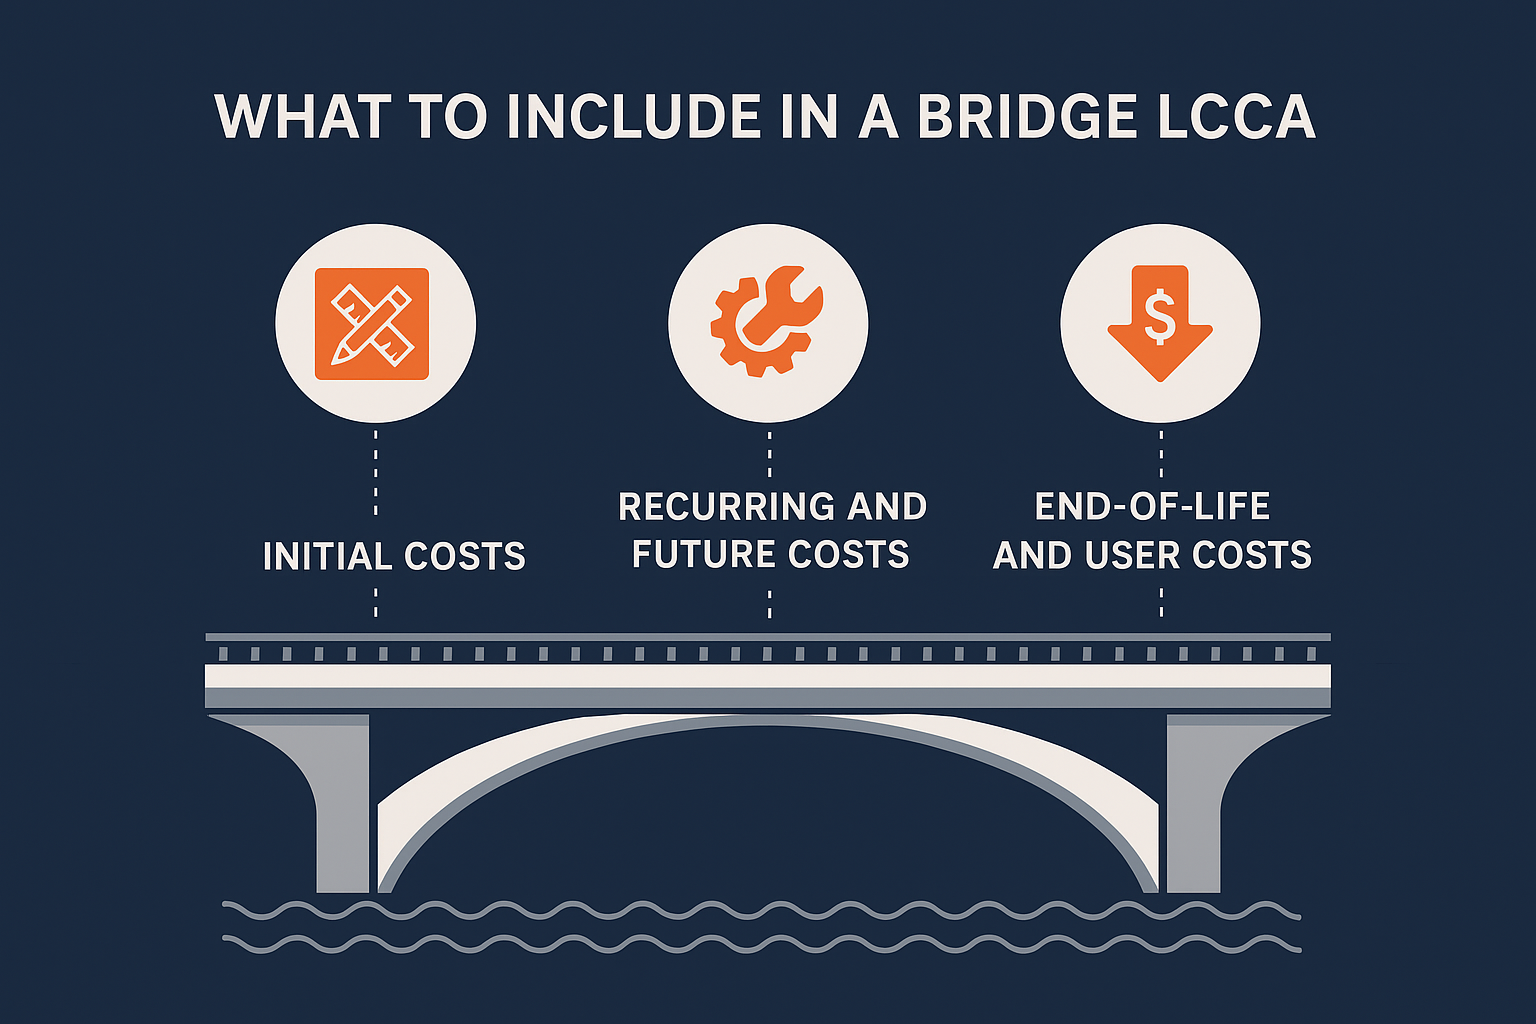
Initial costs
Initial costs include design, land acquisition, construction, and commissioning. These are the easiest to quantify and the numbers your estimating team already works with. Material choices made at this stage directly determine how large the future maintenance and rehabilitation costs will be.
Recurring and future costs
Recurring costs cover routine inspection, preventive maintenance, and periodic rehabilitation across the full service life. For Indian bridge conditions, this category must account for monsoon-driven deterioration cycles, bearing and expansion joint replacement intervals, and structural strengthening triggered by increased traffic loading.
The recurring cost component typically dwarfs initial construction costs when calculated over a 75-year service life.
End-of-life and user costs
End-of-life costs include demolition or decommissioning at the close of the service period. User costs, often excluded from agency analyses, capture the economic burden of traffic delays and detours during major maintenance interventions. Including both categories gives you the complete ownership picture that authorities now expect to see.
How to run a BLCCA step by step
Running a bridge life cycle cost analysis follows a clear sequence. Missing any step produces unreliable outputs that won't hold up under agency review during bid evaluation.
Define scope, alternatives, and service life
Start by fixing your analysis period - typically 75 to 100 years for major Indian bridge projects - and listing the alternatives you're comparing. Each alternative needs a clearly defined rehabilitation schedule so you compare equivalent service levels, not just upfront build costs.
Common alternatives contractors evaluate include:
- Conventional RC deck vs. prestressed concrete deck
- Standard elastomeric bearings vs. seismic isolation systems
- Conventional expansion joints vs. integral abutment design
Collect cost data and apply discount rates
Pull estimates for every cost phase: construction, routine maintenance, periodic rehabilitation, and end-of-life. Apply a discount rate of 3 to 6 percent to convert future costs to present value. Ignoring escalation factors for materials like bearings and expansion joints distorts the final comparison.
Getting discount rate and escalation assumptions right matters more than the precision of any individual line item.
Interpret results and document assumptions
Compare net present value totals across your alternatives and identify which design minimizes total ownership cost. Agencies expect you to show your working, so document every assumption clearly.
Present the output in a format reviewers can follow - a table showing NPV by phase for each alternative works well in most bid submissions.
Methods and models used in bridge LCCA
Three core modeling approaches dominate bridge life cycle cost analysis in Indian infrastructure practice. Understanding which method fits your project scale and data availability determines how credible your analysis looks to a technical review committee.
Deterministic models
Deterministic models use fixed inputs: a set maintenance schedule, defined rehabilitation triggers, and a single discount rate. You feed in known cost figures and the model returns a single NPV for each alternative. These models work well when historical maintenance data is available and the design alternative comparison is straightforward.
Deterministic outputs are easy to audit, which makes them the preferred format for most NIT technical submissions.
Probabilistic models
Probabilistic models account for uncertainty by running the analysis across a range of inputs. Monte Carlo simulation is the most common technique, running thousands of iterations where variables like material deterioration rates and rehabilitation timing shift within defined bounds. The output is a distribution of likely costs rather than a single number.
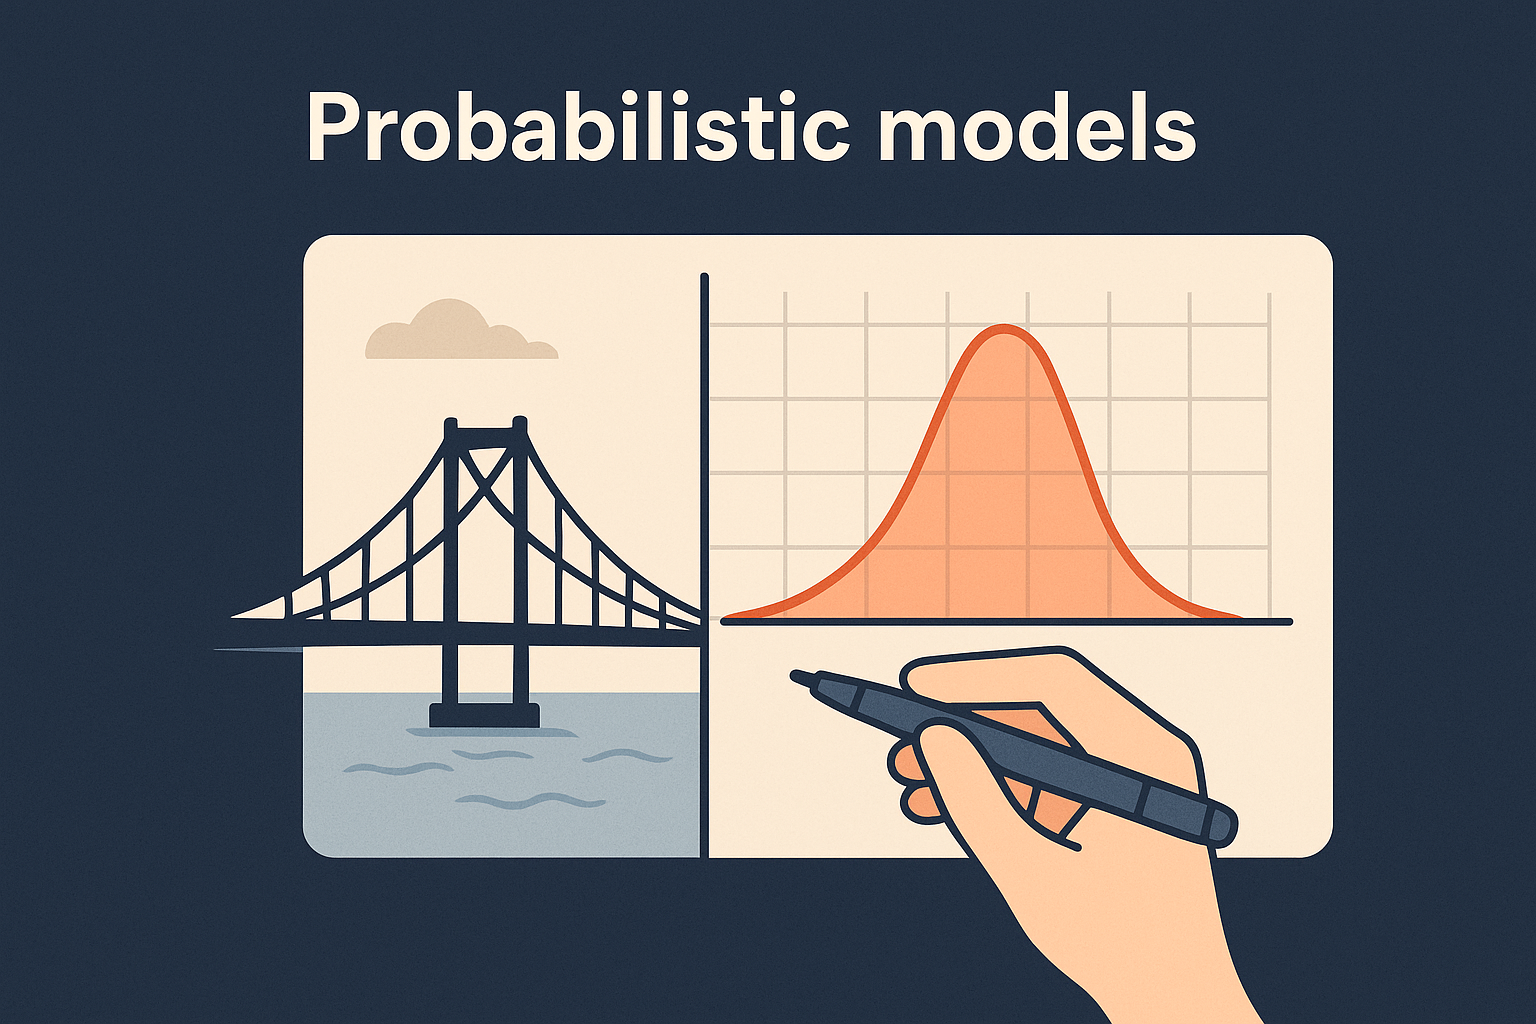
These models suit large corridor projects where material performance data is limited or where seismic or flood risk introduces significant cost variability across the service life. Most major consultants on NHAI projects now use probabilistic approaches for flagship structures.
Tools and workflows to do BLCCA faster
Most contractors running a bridge life cycle cost analysis start with spreadsheets. For simple two-alternative comparisons that works fine, but manual error in escalation and discount calculations becomes a real problem when you compare four or five design alternatives across a 75-year service period.
Spreadsheet-based workflows
Spreadsheets give you full control over assumptions and produce outputs your bid reviewers can verify without specialist software. Build your template with separate input cells for discount rate, escalation rate, and rehabilitation intervals so you can run sensitivity checks quickly. A clean layout covering these blocks keeps the analysis audit-ready:
- Initial construction cost by component
- Annual routine maintenance cost
- Periodic rehabilitation schedule with trigger years
- Net present value summary by alternative
Dedicated LCCA software
Purpose-built tools handle probabilistic simulation and sensitivity analysis faster than any spreadsheet. RealCost, developed by the Federal Highway Administration, is widely referenced in bridge consulting practice for its transparent, auditable methodology.
Dedicated software generates output reports that match the documentation format most technical review committees expect, cutting revision cycles during bid evaluation.
These tools also integrate deterioration rate inputs directly into the model, removing the manual step of converting condition survey data into rehabilitation cost estimates.
Next steps for better bid and asset decisions
A bridge life cycle cost analysis gives you a sharper technical position on every major structure bid. Quantifying maintenance liabilities and comparing design alternatives doesn't just improve your submission quality, it builds the credibility that technical review committees look for across multiple procurement cycles.
Start with the tenders where whole-life costing criteria already appear in the NIT. Build your spreadsheet template once, document your assumptions clearly, and run the analysis as a standard estimating step rather than a one-off exercise each time a relevant tender appears.
Finding the right tenders to apply this analysis to is where most BD teams lose time. Arched helps you identify bridge and infrastructure tenders matched to your company's actual credentials, so you spend your analysis effort on projects where you have a genuine path to winning. See how Arched works and check what's active in your pipeline right now.