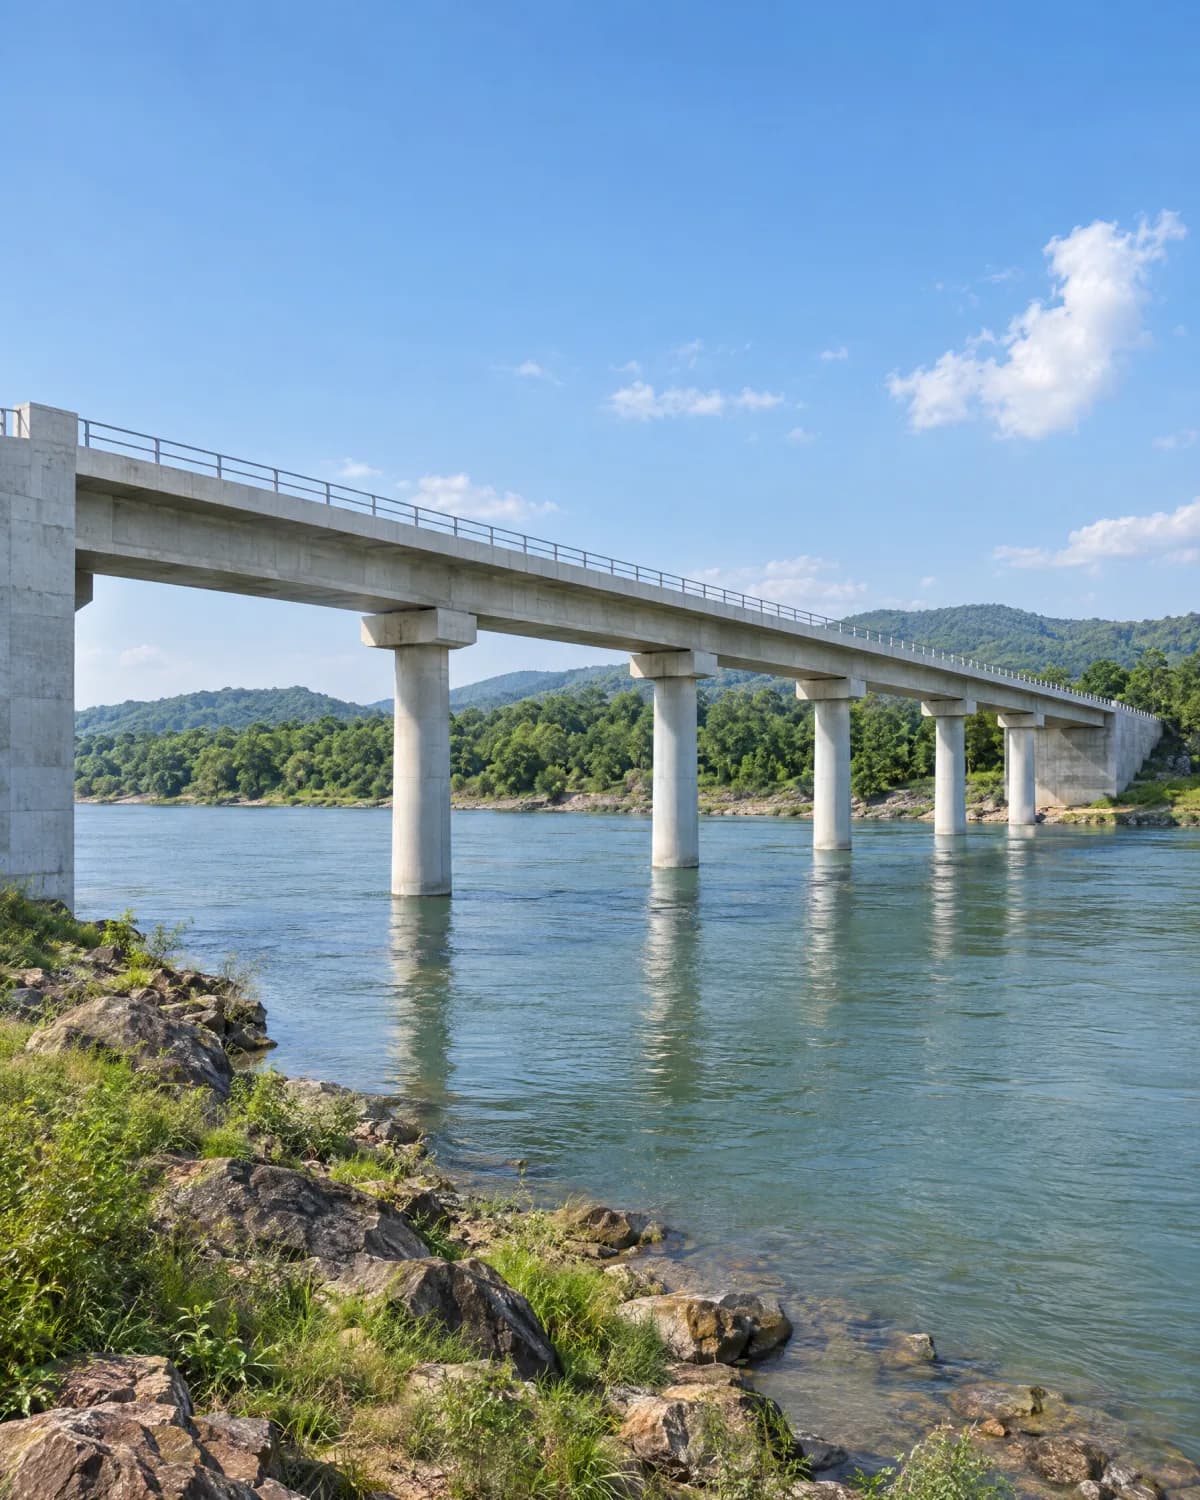
Road, culverts, bridges and sea walls on an island.
- Two-lane highway
- 47 km
- Box culverts
- 100+
- Minor bridges
- 6
- Tetrapod sea armour
- ~420 m
- Numbers, each sourced
- ~2,000
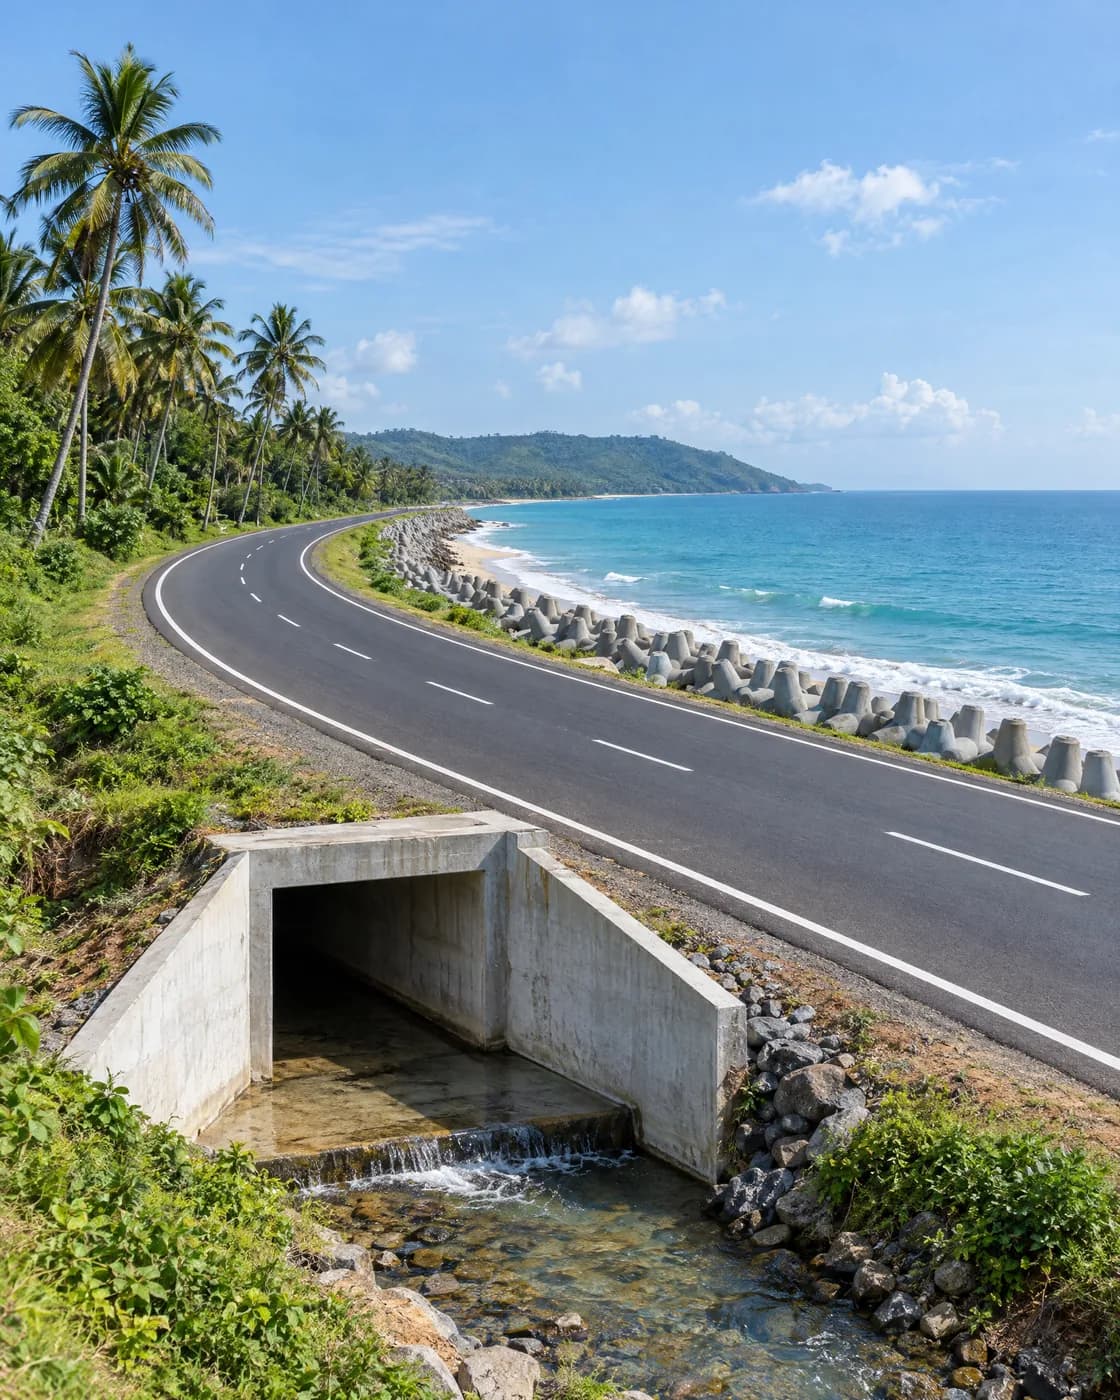
A 47 km road and the structures along it.
The cost estimate for a detailed project report: the bill of quantities for every piece of civil work on a highway that runs around the island, plus two short spurs. An estimator usually builds one by hand, in large spreadsheets, over about 20 working days.
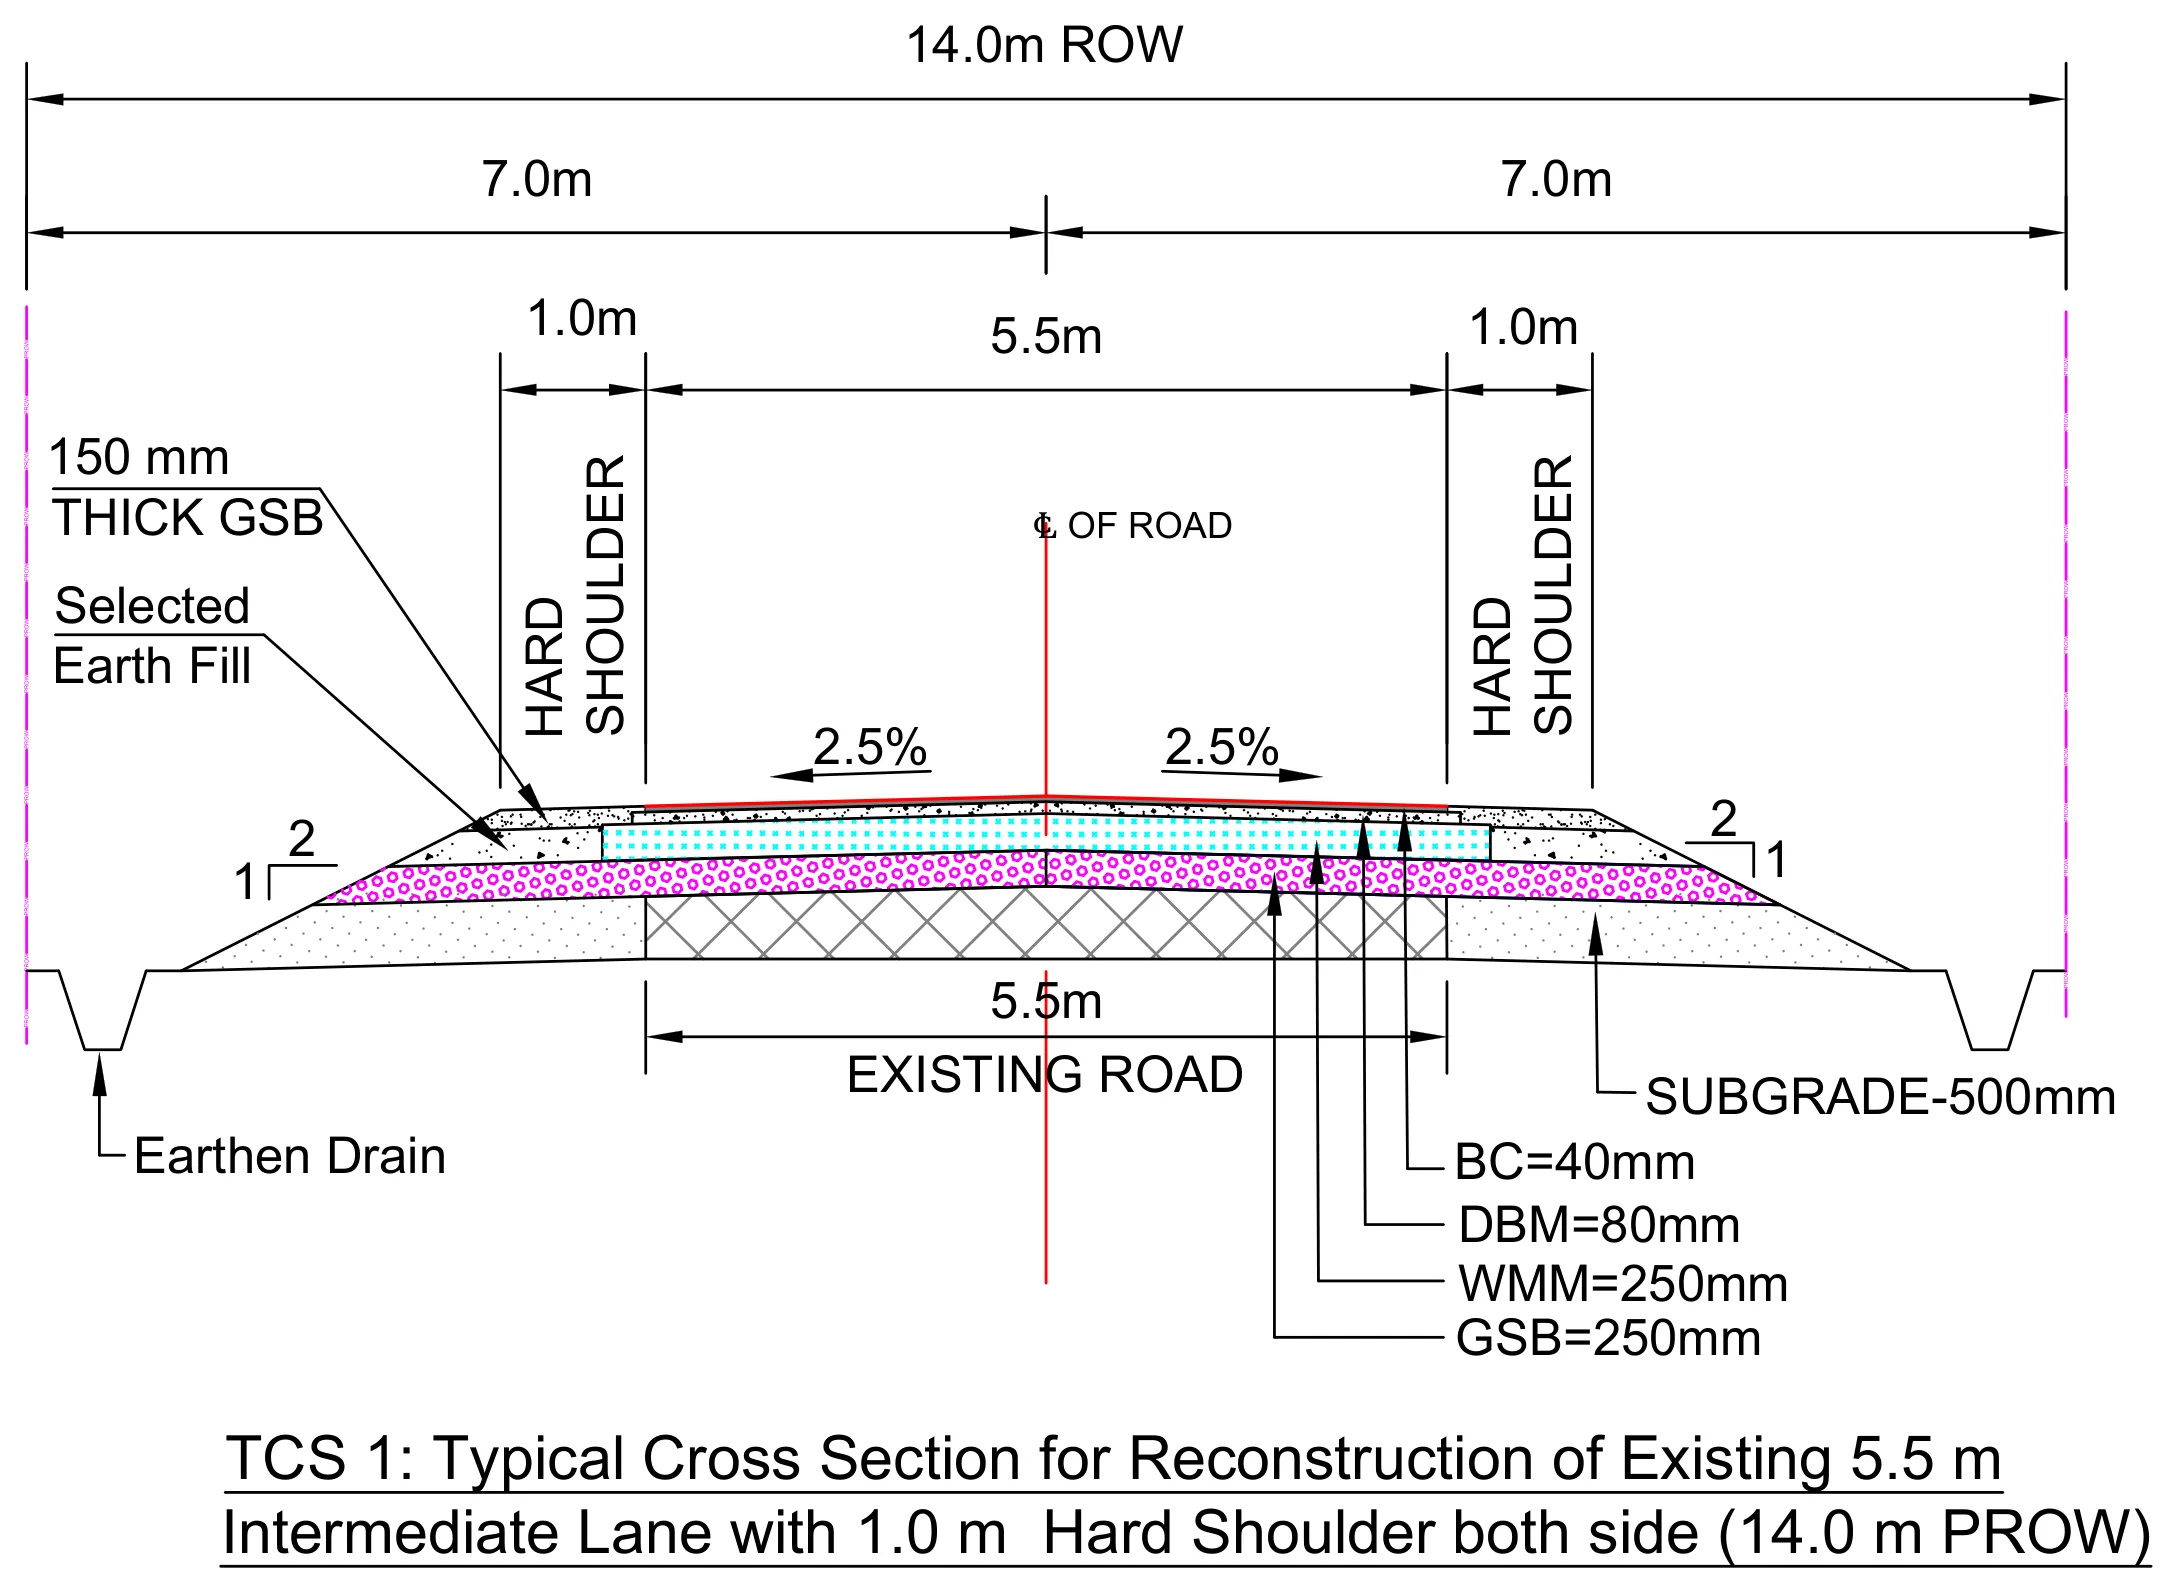
The work changes along the road. Most of it is reconstruction, a long stretch is widening, the built-up areas need footpath-drains and one stretch is a new realignment. Each has its own cross-section. The schedule of where each applies splits the road into nearly 30 stretches, broken up by the bridges.
| Part | Scale |
|---|---|
| Road | About 47 km of two-lane highway, in four typical cross-sections |
| Box culverts | Over 100, each listed with its size, plus typical drawings |
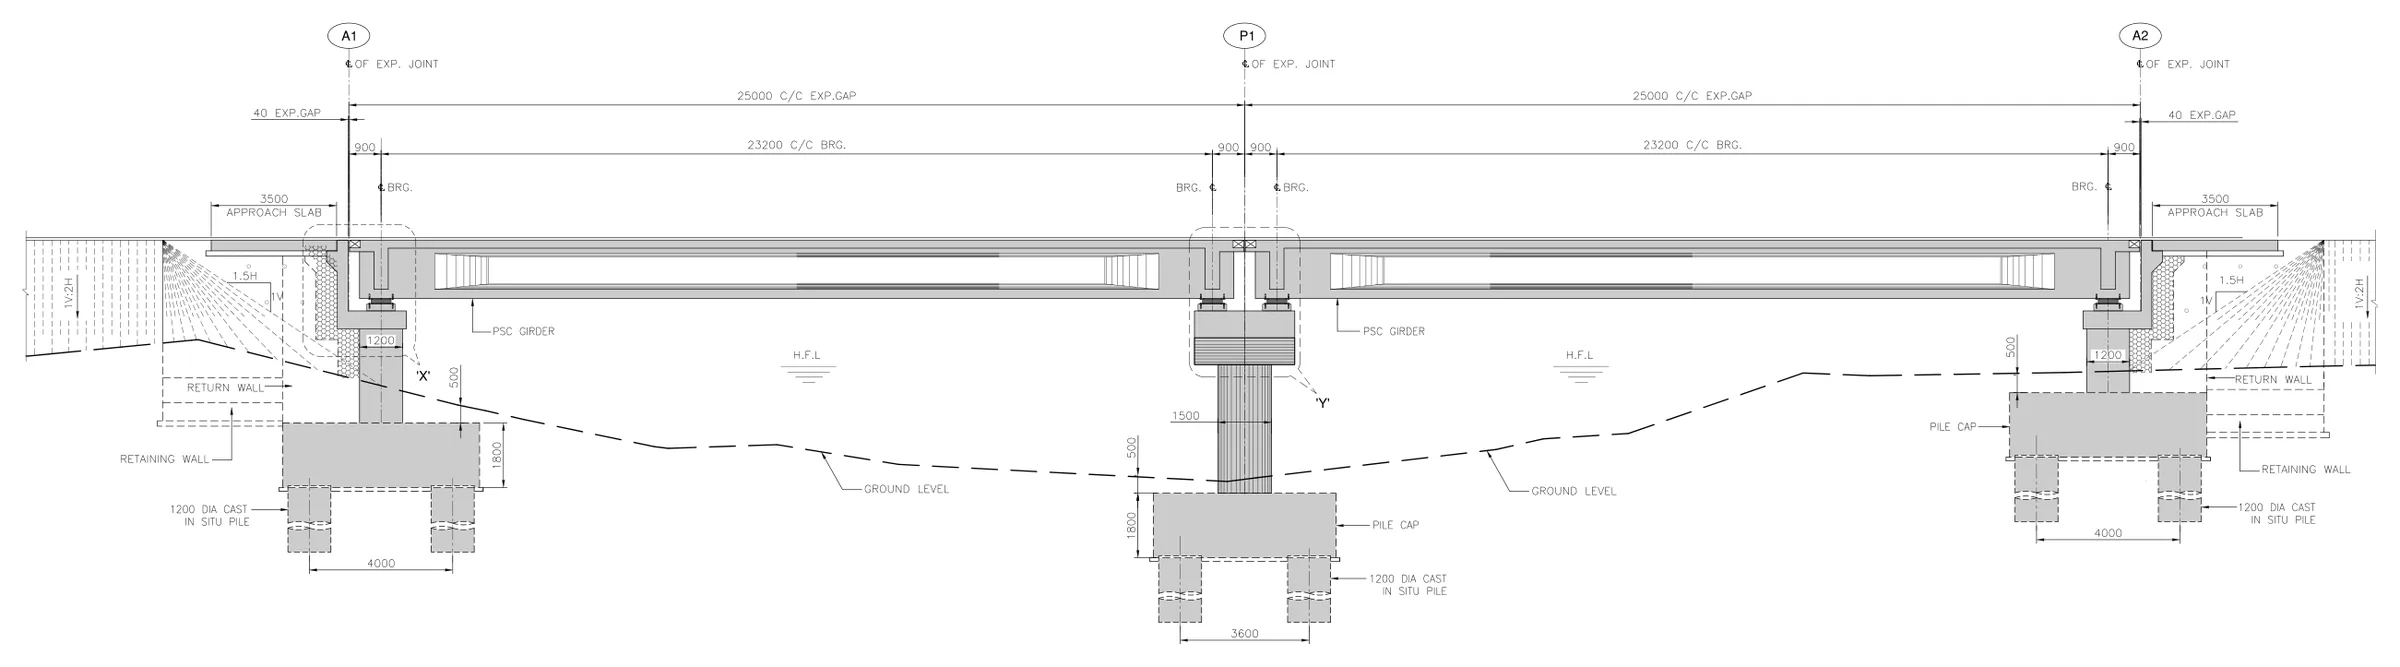
| Minor bridges | Six, each with its own general arrangement: PSC girders on piled foundations |
| Walls | About 5 km of toe wall and about 540 m of retaining wall, 2 to 3 m high |
| Shore protection | About 420 m of precast tetrapod armour on the sea side |
| Roadside drains | About 89 km of earth drain, and footpath-cum-drain through built-up stretches |
| Also | Junctions, extra widening on curves, signs, markings and safety |
Shipping drives most of the material rates.
A mainland schedule of rates doesn’t apply here. We built up each rate from where its materials, machines and labour come from and how they are shipped across. Most of the engineering judgement in this estimate went into that.
The sea affects the structures as well. Exposure is severe, so the drawings call for stainless steel reinforcement throughout, and labour is priced at the territory’s own minimum wages.
Over 100 culverts from one schedule, and six bridges with their own drawings.
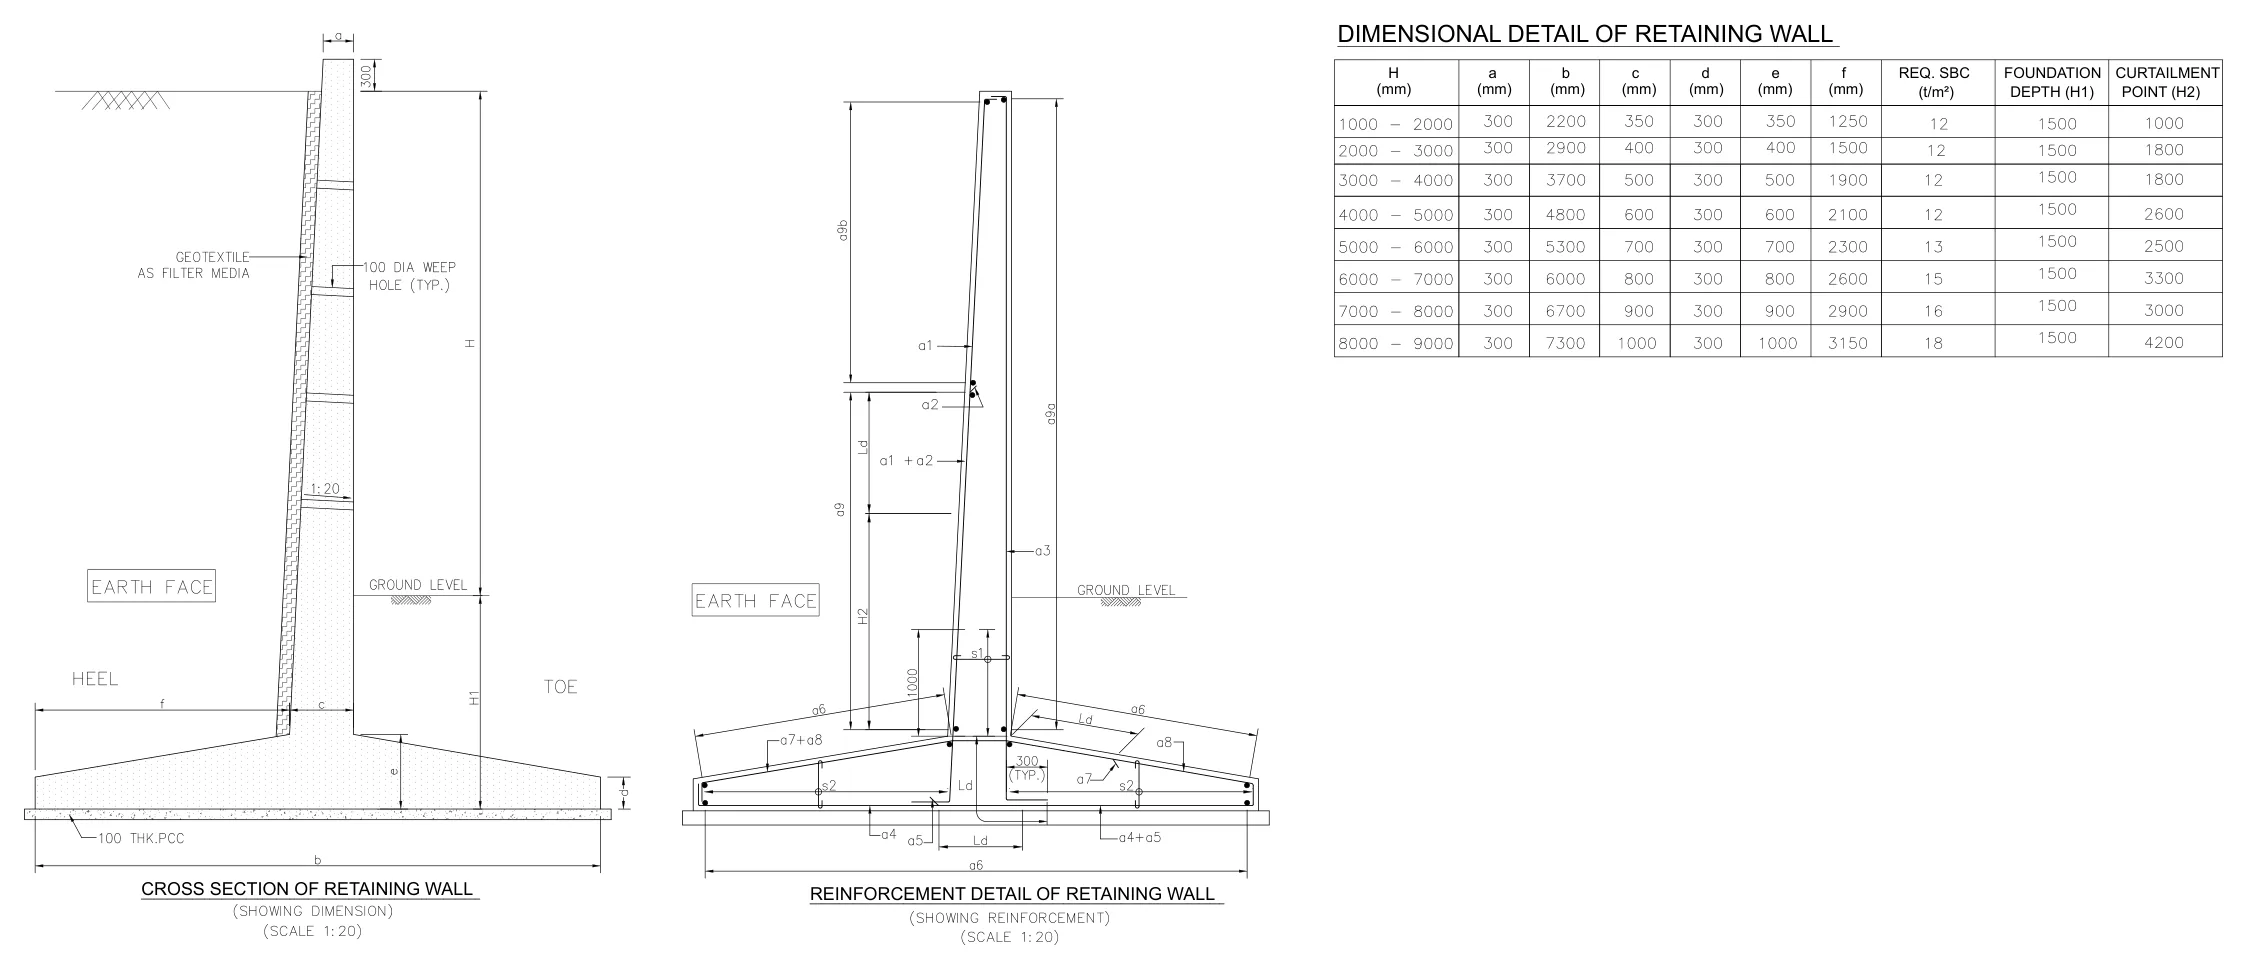
The culverts are listed in a schedule that gives each one’s size and position, and all of them are built to the same typical drawings. Each bridge has its own general arrangement drawing, and wall sizes come from a table by height. Anything the drawings don’t show was flagged rather than priced.
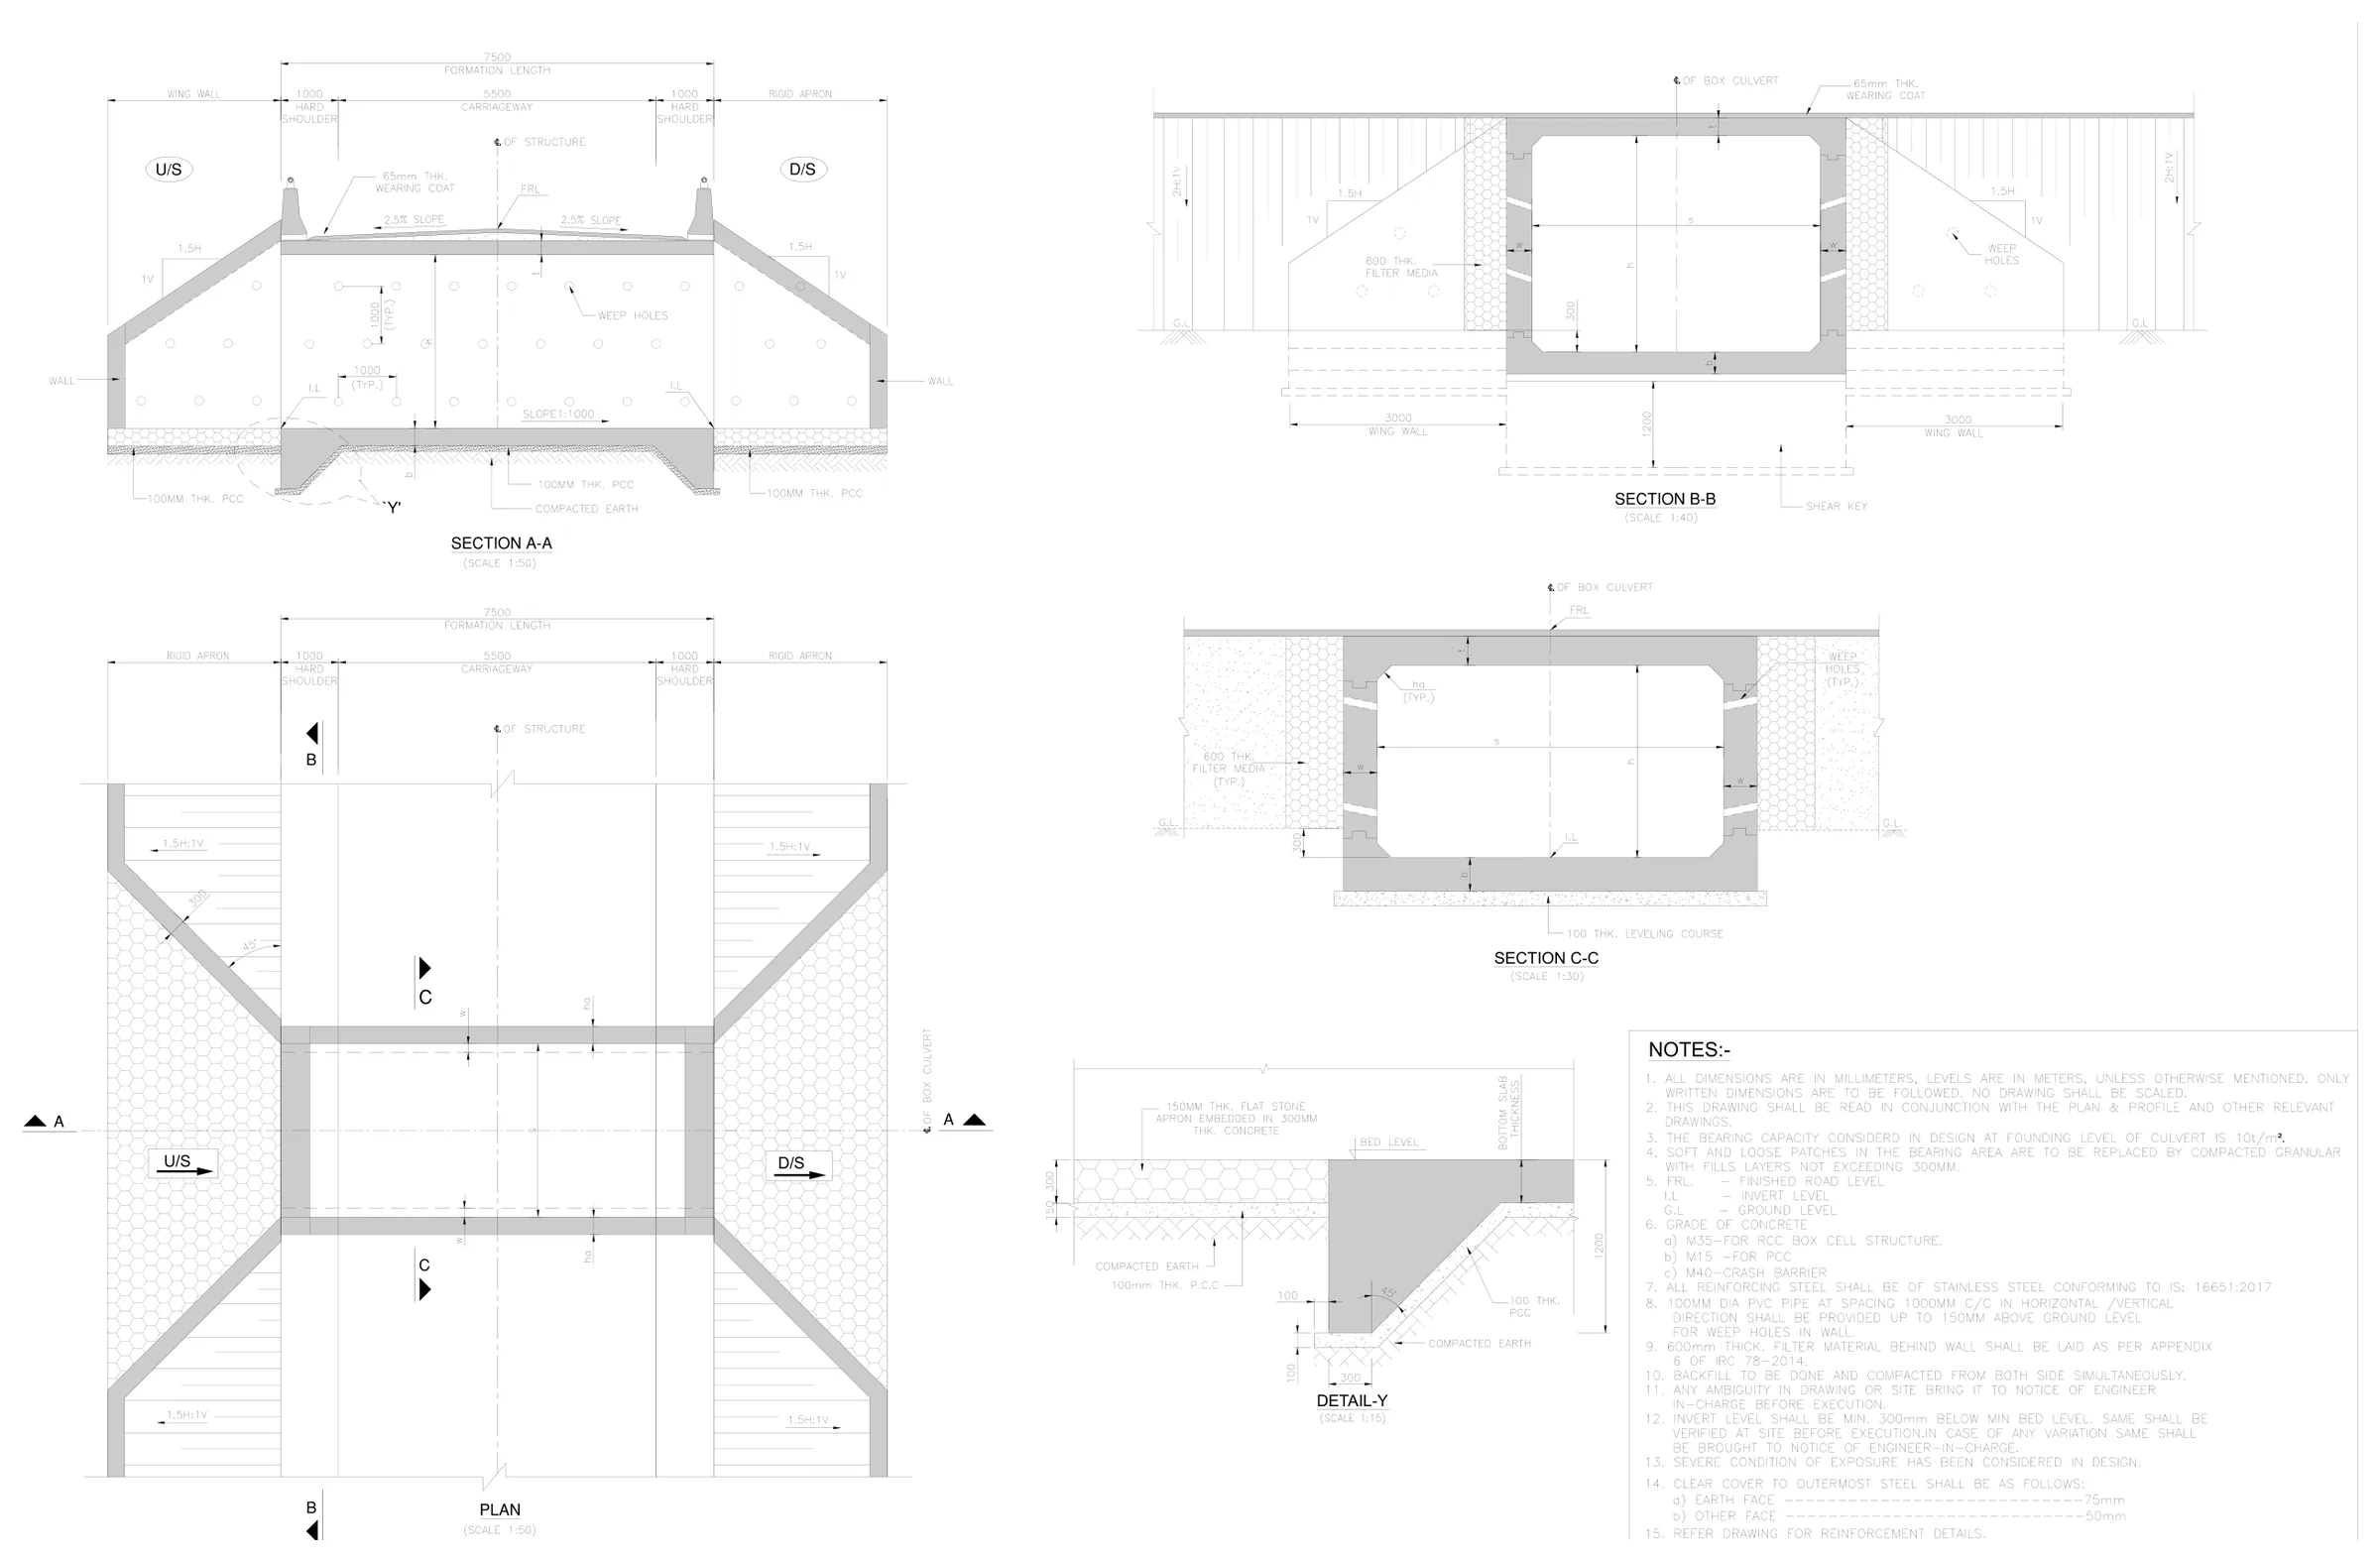
Over 100 box culverts, each sized in the schedule and built from the typical drawing. The drawings don’t show every standard piece, such as a flexible apron or curtain walls. We flagged those against the clause that asks for them for the designer to confirm, and did not add them by default.
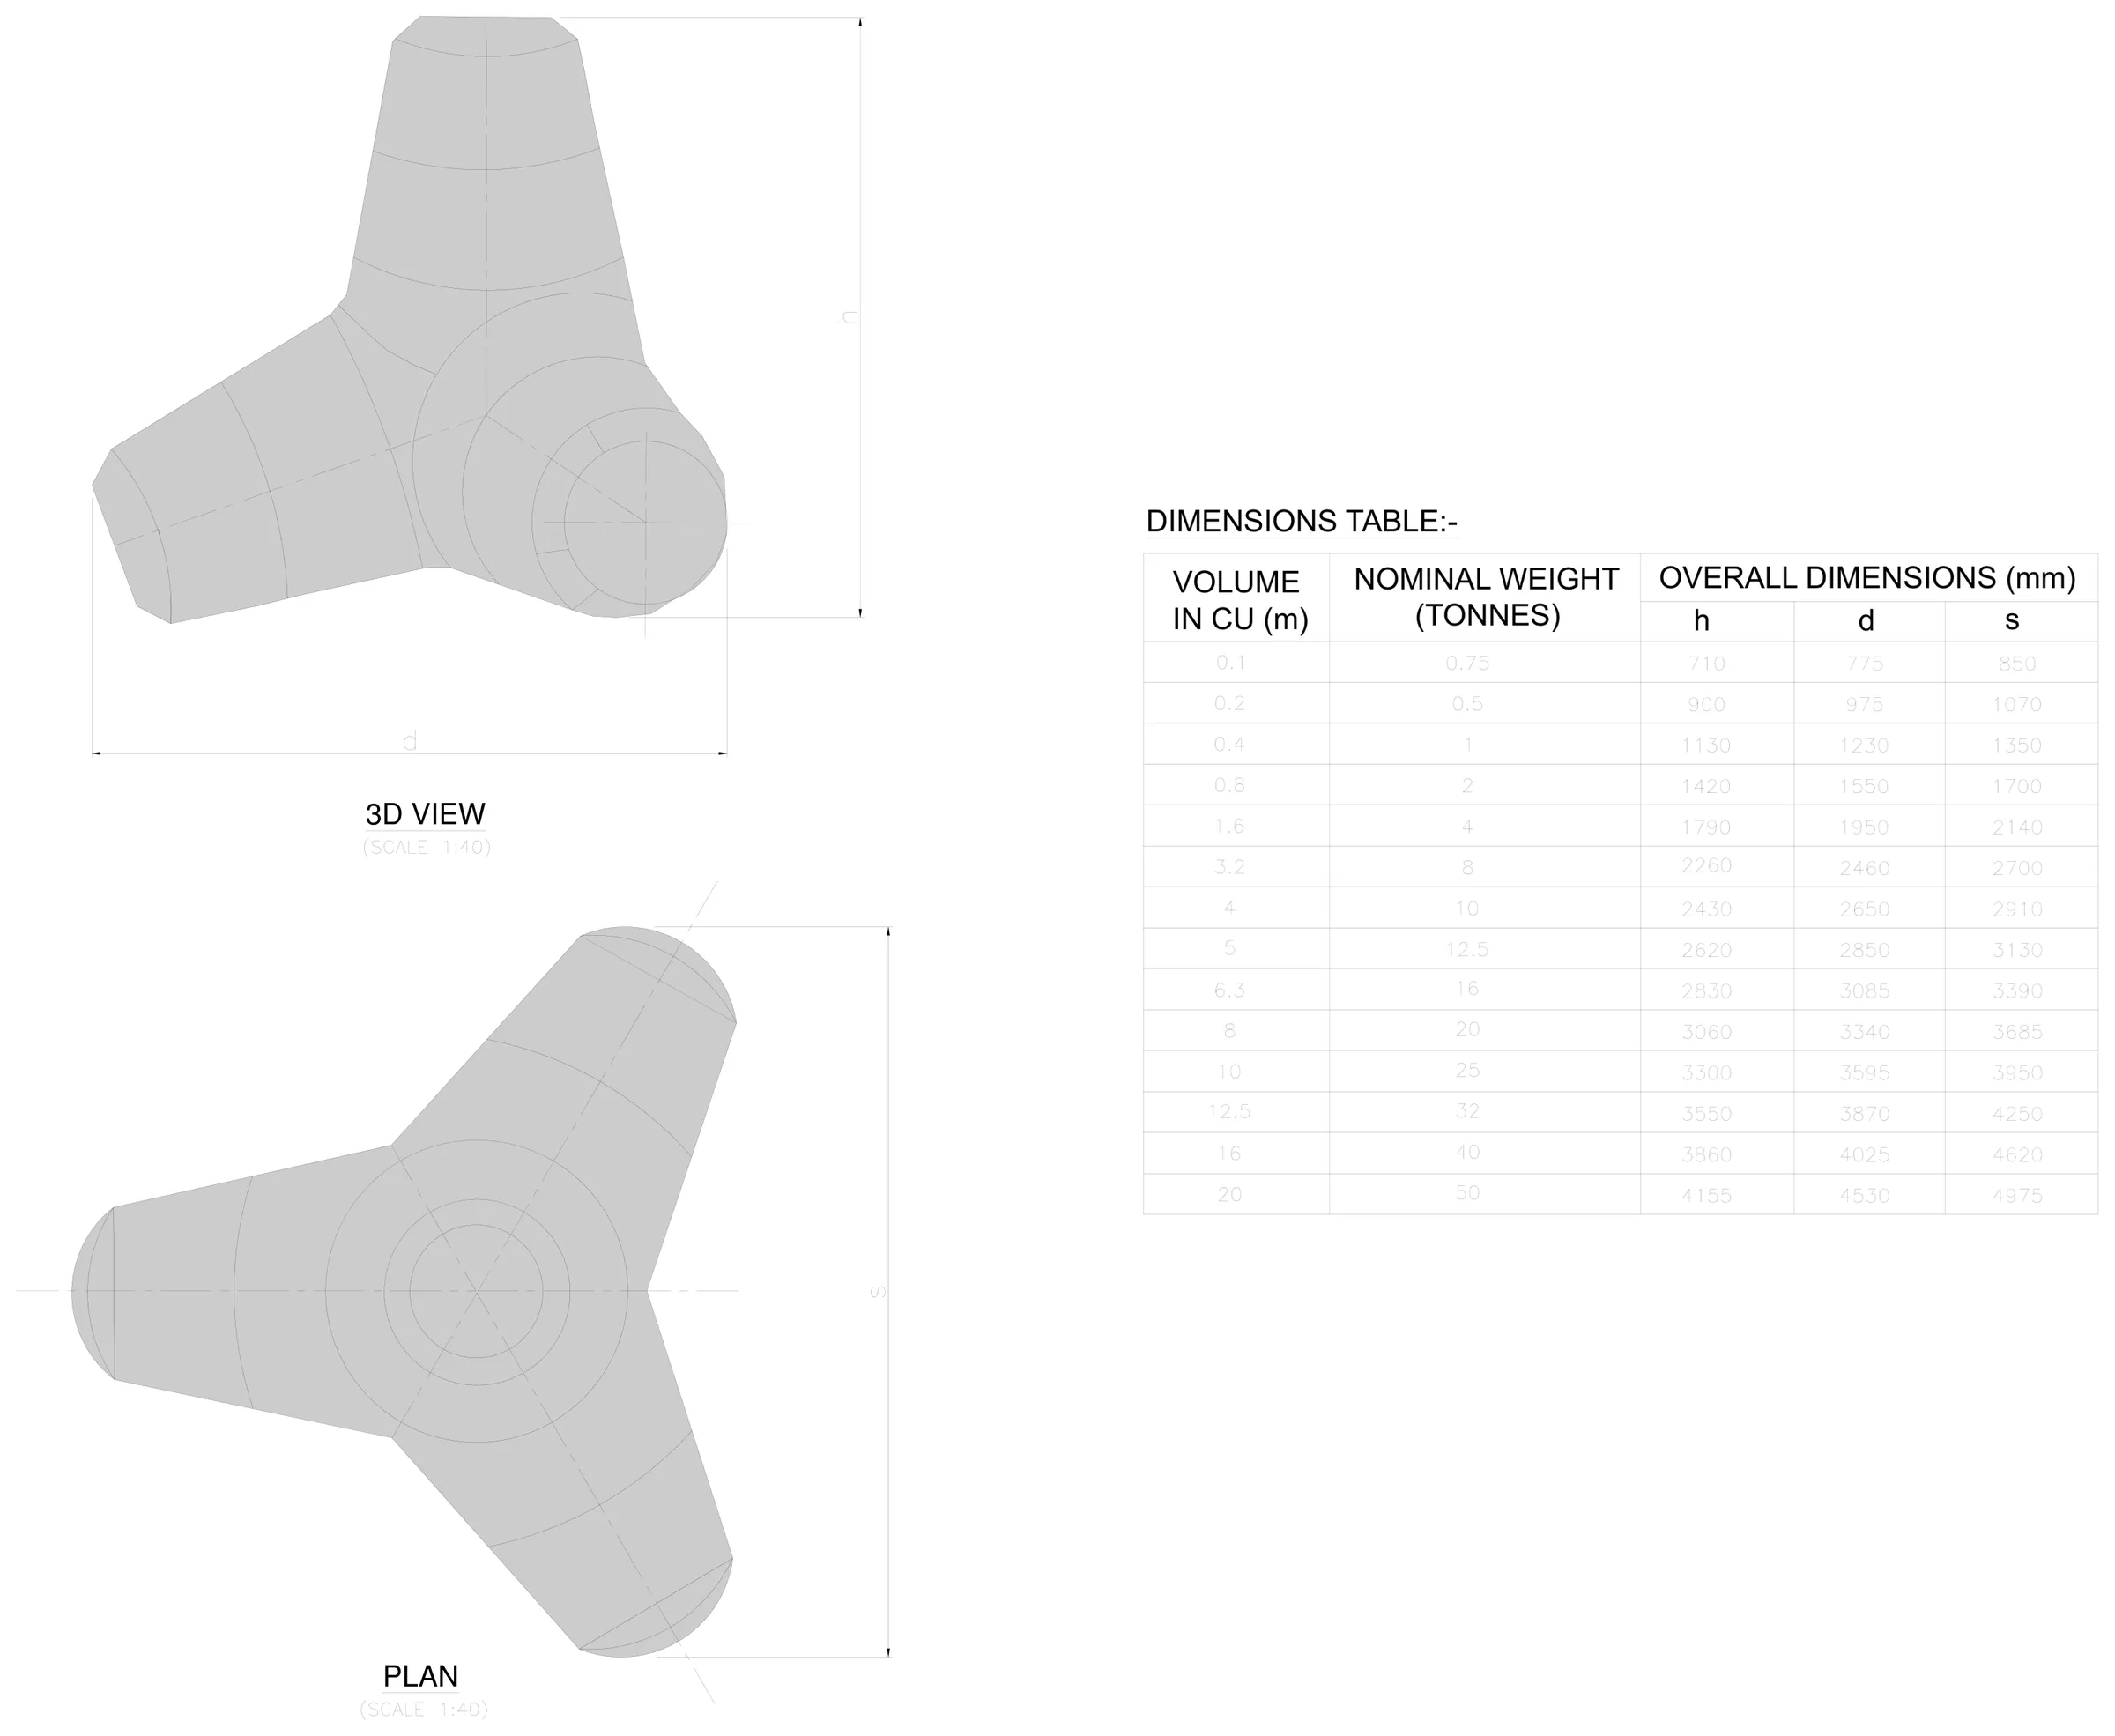
About 420 m of sea-side armour, built from precast concrete tetrapods. The drawing gives the unit and a table of fourteen sizes, from under a tonne to fifty, but not which size or the armour section. Those are engineering decisions, so they went to our engineer with the effect of each option.
- 01
Read all the files
Sixteen files: about 120 drawing pages, schedules, survey reports and about 100 site photos. Each page was sorted and each printed figure recorded with its position on the page.
- 02
Kept only the newest drawings
Several sets arrived in more than one issue, one reissued under a new number. Fourteen older items were recognised and set aside, each with the reason.
- 03
Collected the data for each location
For each culvert, wall and stretch, we pulled together the cross-section that applies, the road level, the schedules covering it and the site photos of what is there now.
- 04
Built the quantities as live formulas
Pavement layers, earthwork, culverts, bridges, walls, drains, shore protection, signs and junctions, each as work items under the national standard data book.
- 05
Priced the road at island rates
Two revisions, each with an abstract, a rate sheet and a list of clarifications with the cost effect of each.
- 06
Sent only real decisions to an engineer
About 60 figures needed confirming at first. That came down to 9 decisions for our engineer, such as picking the tetrapod size from a table of sizes.
Each number links back to its drawing or clause.
Each value in the estimate is stored with how it was found (read, calculated, assumed or decided), its inputs and its source. You can follow any figure from the abstract down to the highlighted spot on the drawing or the code clause, and see what moves if it changes. Two independent runs from the same files gave identical quantities, 202 of 202.
- Documents cited: codes, manuals, published projects
- 41
- Internal checks on every build
- ~160
- Figures to confirm, reduced to decisions
- 60 → 9
- Older drawing issues set aside
- 14
Gaps in the drawings, and how we handled them.
Drawings at this stage leave things out. Estimators often fill the gaps from experience without writing it down. Here each gap went into the estimate as a clarification, with the basis adopted and its effect on cost, so the client and designer could answer it.
- 01Embankment heightsThe typical sections don't give the height to raise the road. Taken from the levels on the plan and profile, where it can be large.
- 02Footpath-cum-drainAbout 4.8 km of it through built-up areas, with no detail on the sections. Held out until the standard drawing confirms it.
- 03Existing surfaceIts thickness isn't given. Taken as 50 mm under the specifications; if thicker, it is priced as dismantling.
- 04Sub-base gradingNot specified. Grading I adopted; the alternative is about 12% cheaper.
- 05Culvert aprons and curtain wallsNot on the typical drawings. Flagged against the code that asks for them instead of being added to the quantities.
- 06Breakwater sectionThe drawing gives the tetrapod unit and a table of sizes but no armour section. Raised as an engineering decision.
The client, consultant, island and roads are withheld. Drawings are cropped to the drawn views, with title blocks, stamps and chainages removed. Cost effects are shown as ratios and shares, not amounts. This describes one estimate; it is not an endorsement by the client or the consultant.