Rainflow Counting Method For Fatigue Analysis Explained
Master the rainflow counting method for fatigue analysis. Learn to convert complex stress data into accurate life predictions for bridges and structures.
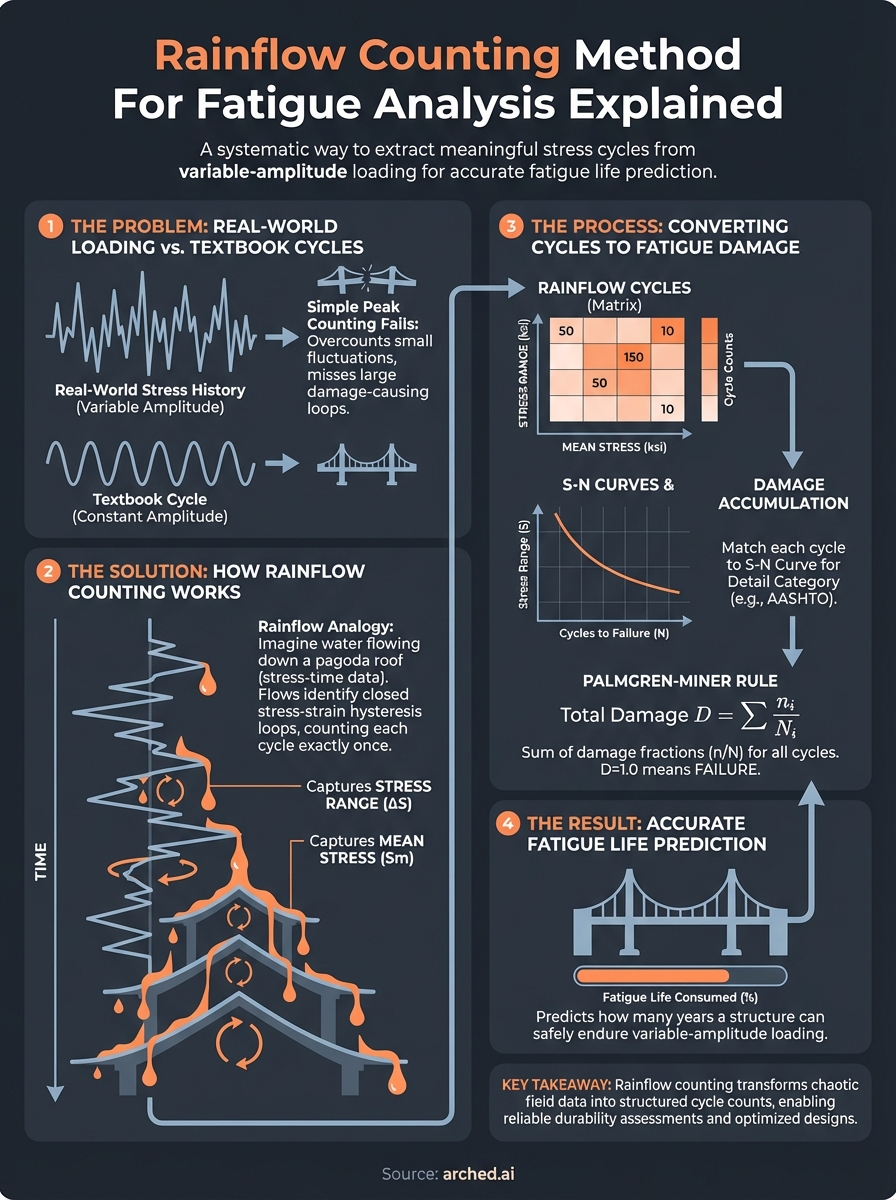
Rainflow Counting Method For Fatigue Analysis Explained
Bridges endure millions of stress cycles over their service life, vehicles crossing, wind gusts, thermal expansion and contraction. Each cycle chips away at structural integrity, but not all cycles are equal. Some cause significant damage while others barely register. The rainflow counting method for fatigue analysis provides engineers with a systematic way to extract meaningful stress cycles from chaotic, real-world loading histories and translate them into actionable fatigue life predictions.
Without this method, analyzing variable-amplitude loading would be nearly impossible. Raw stress-time data from a bridge girder under traffic loads looks like noise. Rainflow counting transforms that noise into discrete, countable cycles that can be plugged into S-N curves and damage accumulation models. It's the critical link between field measurements and fatigue design calculations.
At Arched, we integrate fatigue performance checks, including AASHTO LRFD requirements, into our automated bridge analysis platform. When our generative design engine evaluates thousands of structural configurations, fatigue resistance is one of the key parameters that separates viable designs from failures. Understanding how rainflow counting works helps engineers interpret these results and make informed decisions about durability.
This article breaks down the rainflow counting method from first principles: what it is, how the algorithm works, why it became the industry standard, and how it fits into modern fatigue analysis workflows. Whether you're reviewing hand calculations or validating automated outputs, this explanation gives you the foundation to apply the method with confidence.
Why rainflow counting matters in fatigue analysis
You can't predict how long a bridge will last without knowing how many stress cycles it experiences. That sounds simple until you realize real-world loading creates stress histories that look nothing like the clean, constant-amplitude cycles used in textbook fatigue curves. A single day of traffic produces thousands of stress fluctuations with different amplitudes, mean values, and sequences. Traditional peak-counting methods fail to capture this complexity, which is why the rainflow counting method for fatigue analysis became the industry standard.
Why traditional cycle counting falls short
Simple cycle counting techniques like peak counting or level-crossing methods treat every local maximum as equally important. When you apply these approaches to variable-amplitude loading, you overcount small fluctuations and miss the true damage-causing cycles embedded in the signal. A bridge girder under mixed traffic might show hundreds of minor stress peaks from passenger vehicles, but the real fatigue damage comes from fewer, larger cycles caused by heavy trucks. Peak counting assigns equal weight to both, producing fatigue life estimates that can be off by an order of magnitude.
What rainflow captures that simpler methods miss
Rainflow counting solves this problem by identifying closed hysteresis loops in the stress-strain response. When you load a structure, then partially unload it, then reload to a higher level, simple methods count multiple cycles where only one meaningful fatigue cycle occurred. Rainflow recognizes that the stress-strain path forms a closed loop and counts it as a single cycle with the appropriate range and mean stress. This matches the actual physical behavior of crack initiation and propagation.
The algorithm preserves the sequence-dependent nature of loading. If you apply a large stress cycle followed by several small ones, the rainflow method accounts for this differently than if you reverse the order. Material memory effects and residual stresses matter in fatigue, and rainflow counting captures these influences through its cycle extraction logic.
"Rainflow counting is the only method that consistently matches laboratory fatigue test results across different loading spectra and materials."
The cost of getting fatigue predictions wrong
Underestimating fatigue damage leads to premature structural failures and expensive emergency repairs. Overestimating it wastes material and drives up construction costs unnecessarily. You need a counting method that reflects actual damage accumulation, not one that introduces systematic errors. Engineers have validated rainflow counting against decades of experimental data, from welded steel connections to aluminum aircraft components. It consistently produces fatigue life predictions within acceptable error margins when paired with appropriate S-N curves and damage models.
Bridge owners face tight budgets and long service-life requirements. When you design a structure expected to last 75 years, small errors in cycle counting compound into massive discrepancies in predicted fatigue life. A 10% error in equivalent stress range can translate to a 30% error in life prediction for typical steel details. Rainflow counting minimizes these errors by extracting cycles that correspond to the physical mechanisms driving crack growth. The method isn't perfect, but it's the most reliable tool available for converting field measurements into fatigue damage calculations.
The fatigue basics you need before counting cycles
You need to understand how fatigue damage accumulates before the rainflow counting method for fatigue analysis makes any sense. Fatigue failure happens when cyclic loading creates microscopic cracks that grow until a structural component breaks, even though each individual stress cycle remains well below the material's ultimate strength. Steel bridge girders can fail at stress levels 30% of their yield strength if those stresses repeat millions of times. The counting method quantifies those repetitions, but you must first grasp what you're counting and why it matters.
What causes fatigue failure in structures
Fatigue cracks initiate at stress concentrations like welds, bolt holes, or surface imperfections. Each stress cycle drives the crack tip forward by a microscopic amount through a process called crack propagation. You might not see any damage after 10,000 cycles, but after 1,000,000 cycles that invisible crack becomes a structural problem. The damage accumulates silently until the remaining cross-section can no longer support the applied loads.
Bridge details experience different fatigue sensitivities based on their geometry and connection types. A welded cover plate termination fails much faster than a plain rolled section under identical loading because the weld creates geometric discontinuities that amplify local stresses. You can't ignore these details when evaluating fatigue life, which is why design codes classify connections into categories with different resistance curves.
Understanding stress cycles and amplitude
A stress cycle consists of one complete loading and unloading sequence. You define it by three parameters: stress range (difference between maximum and minimum stress), mean stress (average of maximum and minimum), and the number of repetitions. Stress range drives crack growth rates, while mean stress affects whether cracks stay closed or propagate under tension. Both matter for accurate life predictions.
"Stress range, not maximum stress alone, determines fatigue damage accumulation in most structural details."
S-N curves and damage accumulation
S-N curves plot stress range (S) against number of cycles to failure (N) for specific detail categories. These curves come from laboratory tests where specimens experience constant-amplitude loading until they break. You'll notice the relationship is logarithmic: doubling the stress range might reduce life by a factor of eight. Real structures see variable-amplitude loading, so you need a method to convert irregular stress histories into equivalent constant-amplitude cycles that fit on S-N curves. That's where rainflow counting enters the process.
How rainflow counting works step by step
The rainflow counting method for fatigue analysis gets its name from a visualization technique that treats stress-time data like water flowing down a pagoda roof. You imagine rotating your stress history 90 degrees so time runs vertically and stress runs horizontally. Drops of water start at each peak or valley and flow downward following specific rules. When flows meet, merge, or get interrupted, you've identified a closed stress-strain cycle that contributes to fatigue damage. The algorithm extracts these cycles systematically, ensuring you count each meaningful stress reversal exactly once.
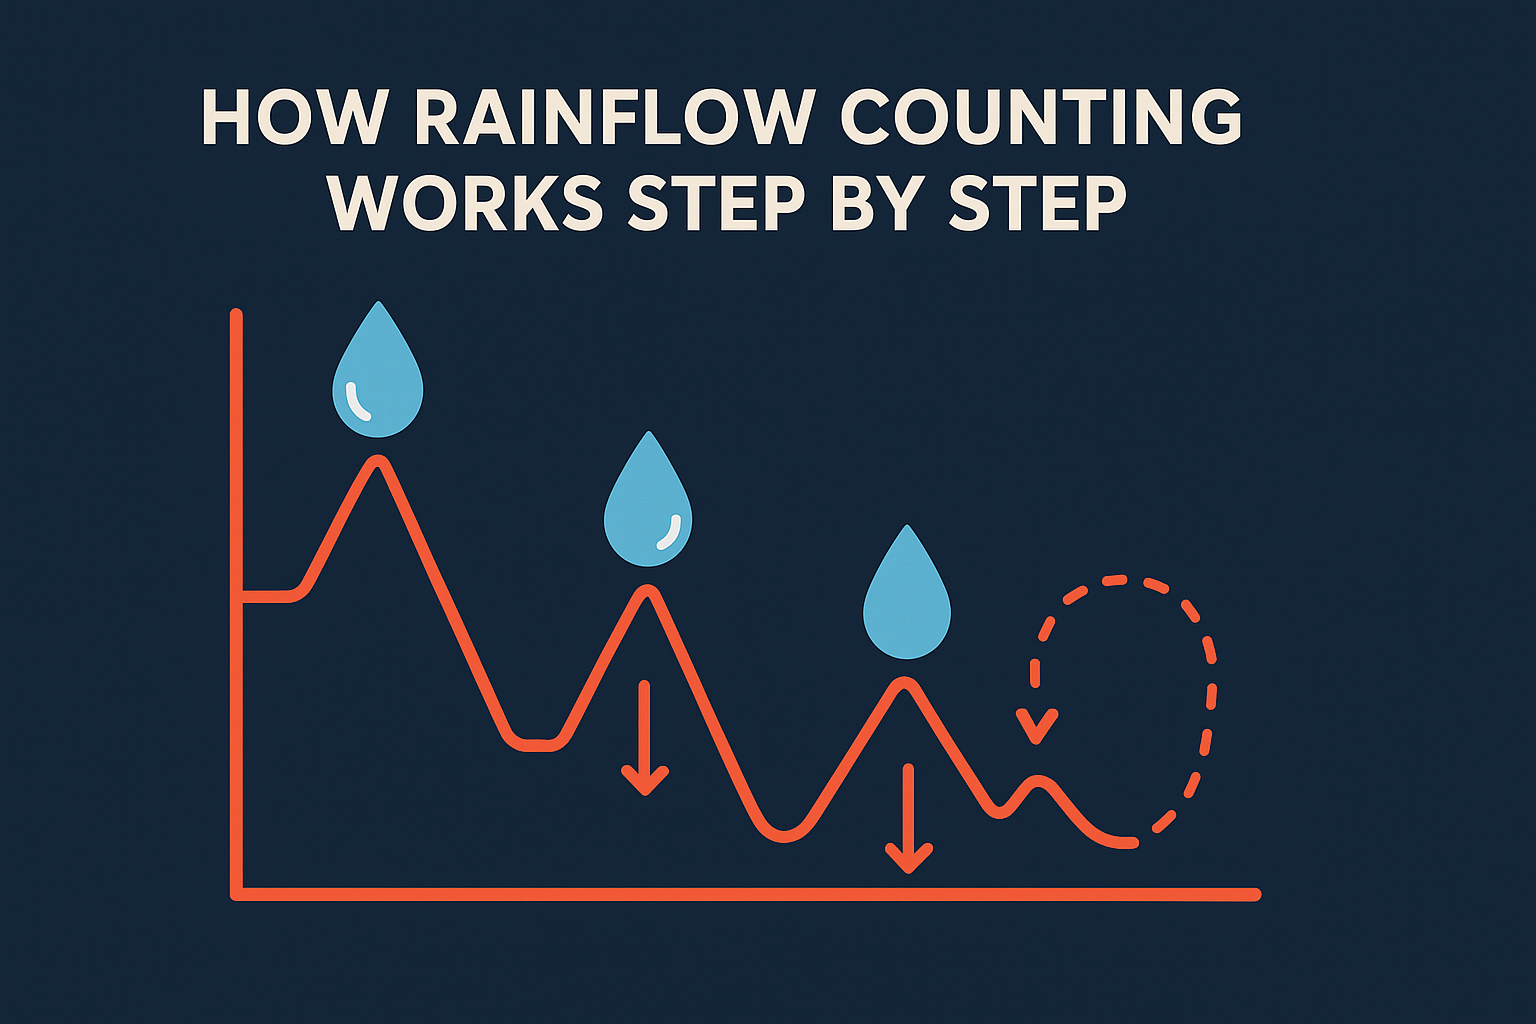
The flow analogy that gives the method its name
Picture your rotated stress history as a series of peaks (roofs) and valleys (gutters). Water drops begin flowing from each local maximum and minimum, moving downward along the stress axis. A flow continues until it encounters one of three stopping conditions: it reaches a point with greater magnitude than where it started, it meets a flow from above, or it runs off the bottom of the dataset. This visualization helps you understand why certain stress reversals form complete cycles while others remain half-cycles that get processed later.
The physical analogy makes the algorithm intuitive, but you don't actually need to draw flowing water. Modern implementations use numerical logic to identify the same cycle pairs through simple comparison rules. You scan through the stress history, track local extrema, and apply matching criteria that replicate what the flow visualization would show.
Identifying cycle pairs in the stress history
You start by reducing your raw stress-time data to a sequence of turning points (peaks and valleys). The algorithm then searches for matching pairs that form closed loops. A pair qualifies as a countable cycle when the stress range between two consecutive reversals is smaller than the ranges that bracket them on both sides. You extract this pair, record its range and mean stress, then remove it from the sequence and continue scanning.
"Each extracted cycle represents one complete stress-strain hysteresis loop that contributes independently to fatigue damage."
Processing residuals and tracking partial cycles
After you extract all the interior cycles from your sequence, you're left with residuals that don't form complete pairs within the current dataset. You handle these by either treating them as half-cycles with reduced damage contribution or carrying them forward to the next data block if you're analyzing continuous monitoring data. The choice depends on whether you're evaluating a finite loading event or an ongoing stress history.
How to convert counted cycles into fatigue damage
Once you've extracted stress cycles using the rainflow counting method for fatigue analysis, you need to translate those cycles into actual fatigue damage. Counting cycles tells you what loading occurred, but it doesn't tell you how close your structure is to failure. You accomplish this conversion by combining your cycle counts with material-specific fatigue resistance curves and a damage accumulation rule. The process transforms abstract stress ranges into quantifiable fractions of total fatigue life consumed.
Applying S-N curves to individual cycles
You match each counted cycle to the appropriate S-N curve based on the structural detail category. AASHTO LRFD provides curves for different connection types, from Category A (plain material) to Category E' (severely stress-concentrated details). For a cycle with stress range ΔS, you read across the S-N curve to find N, the number of cycles to failure at that stress level. If your detail is Category C and you counted a cycle with a 15 ksi range, the curve might show this detail fails after 2,000,000 cycles at that stress level.
"Each cycle consumes a fraction of total fatigue life equal to one divided by the number of cycles to failure at that stress range."
You repeat this lookup for every unique stress range in your rainflow output. A typical traffic loading history might produce 50 different cycle magnitudes after counting. Each gets its own N value from the S-N curve, creating a damage fraction equal to 1/N for that particular cycle type.
Using the Palmgren-Miner linear damage rule
The Palmgren-Miner rule states that you sum individual damage fractions to calculate total accumulated damage. If you observed n₁ cycles at stress range ΔS₁ (which fails after N₁ cycles) and n₂ cycles at ΔS₂ (failing after N₂ cycles), your total damage D equals (n₁/N₁) + (n₂/N₂). You continue this summation across all counted cycles. When D reaches 1.0, you've theoretically consumed 100% of fatigue life and should expect failure.
Accounting for variable mean stress effects
Mean stress affects crack growth rates, but S-N curves assume zero or constant mean stress. When your rainflow output shows cycles with different mean stresses, you apply correction factors like the Goodman or Gerber relations to adjust the equivalent stress range. Tensile mean stresses increase damage, while compressive mean stresses provide some relief. You incorporate these adjustments before looking up N values on the S-N curve, ensuring your damage calculation reflects both stress range and mean stress influences.
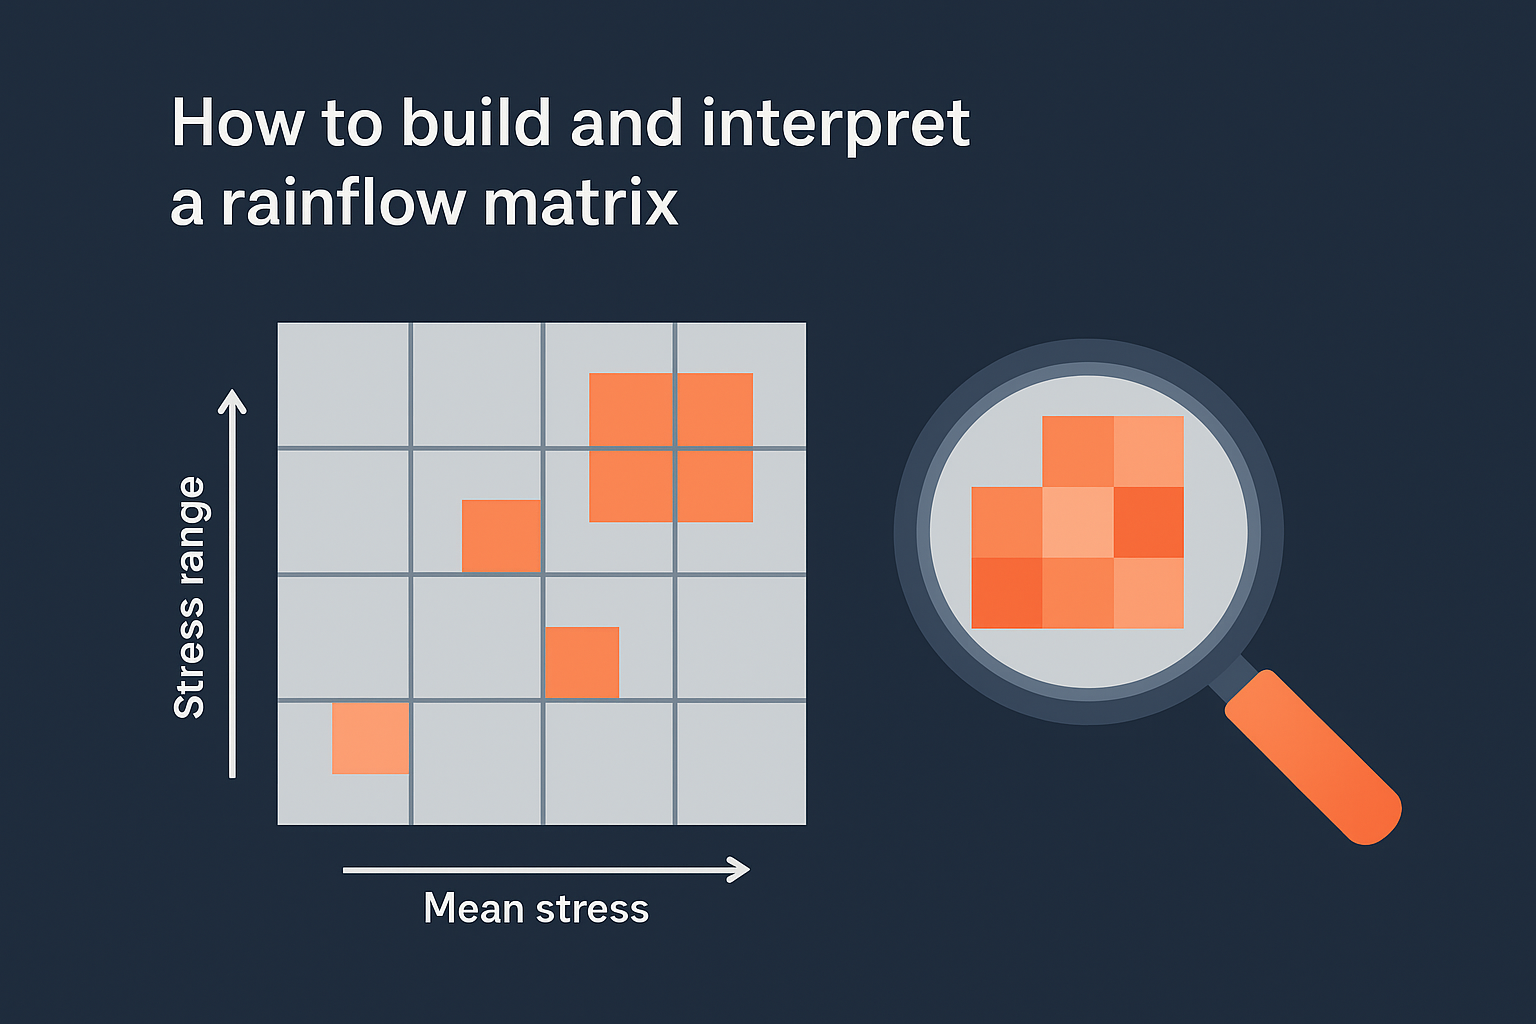
How to build and interpret a rainflow matrix
You organize rainflow cycle counts into a two-dimensional matrix to visualize how fatigue damage distributes across different stress levels and mean stresses. This matrix transforms a long list of individual cycles into a structured format that reveals patterns you'd miss in raw tabular data. Engineers use these matrices to identify which loading conditions drive fatigue life and where design improvements will have the greatest impact. The matrix becomes your roadmap for understanding how traffic patterns, thermal effects, or seismic events translate into structural damage accumulation.
Organizing counted cycles into matrix format
You create a rainflow matrix by binning cycles into discrete ranges for both stress amplitude and mean stress. The vertical axis typically represents stress range (peak-to-valley difference), while the horizontal axis shows mean stress (average of peak and valley). Each cell contains the count of cycles falling within those specific ranges. For a bridge girder analysis, you might use 5 ksi bins for stress range and 3 ksi bins for mean stress, creating a grid that captures the full spectrum of loading combinations.
Your counting algorithm populates this matrix automatically as it extracts cycles. A cycle with a 12 ksi range and 8 ksi mean stress increments the cell at row "10-15 ksi range" and column "6-9 ksi mean." After processing your entire stress history, the completed matrix shows you exactly how many cycles occurred at each stress combination. Most matrices show concentration patterns where certain cells accumulate far more cycles than others.
Reading damage distributions across the matrix
You calculate fatigue damage for each populated cell by multiplying the cycle count by the damage per cycle from your S-N curve. Cells in the upper rows (high stress ranges) contribute disproportionately to total damage even if they contain fewer cycles. You might find that 95% of your damage comes from just 10% of the matrix cells, all clustered in the high-range, high-mean-stress region. This concentration tells you exactly where fatigue cracks will initiate.
"A rainflow matrix reveals which loading scenarios actually matter for structural safety versus those that contribute negligible damage."
Extracting design insights from matrix patterns
You use matrix patterns to guide value engineering decisions and inspection priorities. If most damage concentrates in cells associated with heavy truck loads, you can justify stricter weight limits or load restrictions. When the rainflow counting method for fatigue analysis shows that thermal cycles dominate damage in certain details, you prioritize expansion joint maintenance over live load concerns. The matrix transforms abstract cycle counts into actionable intelligence about where your structure is vulnerable and what operational changes would extend its service life.
Common pitfalls and how to verify your results
You can implement the rainflow counting method for fatigue analysis correctly and still produce unusable results if you skip validation steps or fall into common processing traps. Small errors in cycle extraction compound through damage calculations, turning a 5% counting mistake into a 30% error in predicted fatigue life. Engineers who blindly trust software outputs without verification often discover problems only after structures show premature cracking. You need systematic checks to confirm your rainflow analysis captures real structural behavior rather than artifacts from data processing choices.
Filtering noise versus losing real cycles
Your raw stress data contains measurement noise from sensors, electrical interference, and environmental vibrations. You must filter this noise before counting cycles, but aggressive filtering removes legitimate small-amplitude cycles that contribute to fatigue damage. When you apply a low-pass filter or set a minimum cycle threshold, you're making a tradeoff between data cleanliness and accuracy. Set your threshold too high and you'll underestimate damage from frequent low-stress events. Set it too low and you'll count electrical noise as structural loading.
You verify your filtering choices by comparing cycle distributions before and after processing. Plot your raw turning points against filtered results to see what you eliminated. If your threshold removed cycles with stress ranges above 3 ksi, you've likely discarded real traffic loads. Most validation studies suggest thresholds between 0.5% and 2% of yield stress preserve meaningful cycles while eliminating instrument noise.
Checking your implementation against standard test cases
You validate your counting algorithm by running it against published benchmark datasets with known correct answers. ASTM E1049 provides standard examples that every rainflow implementation should reproduce exactly. When your code processes these test sequences, you should match the reference cycle counts within numerical precision limits (typically six decimal places). Any deviation indicates programming errors or misunderstood algorithm steps.
"Standard test cases catch 95% of implementation errors before you apply rainflow counting to real bridge data."
Beyond test cases, you cross-check results by manually counting cycles in short, simple stress histories. Pick 20-30 data points from your actual measurements and work through the algorithm by hand. Your software should produce identical cycle pairs for this subset, confirming it handles your specific data format correctly.
Key takeaways
The rainflow counting method for fatigue analysis transforms chaotic stress histories into structured cycle counts that drive accurate fatigue life predictions. You've seen how the algorithm extracts meaningful stress-strain loops, how those cycles map to S-N curves through damage accumulation rules, and why validation matters more than blind faith in software outputs. Every bridge experiences variable-amplitude loading that simple counting methods can't handle, making rainflow the only reliable approach for converting field measurements into actionable durability assessments.
Your fatigue analysis workflow depends on correctly implementing this method, from filtering raw data without losing real cycles to interpreting rainflow matrices that reveal damage concentration patterns. When you integrate these calculations into design decisions, you balance safety requirements against construction costs based on quantifiable structural behavior rather than conservative guesswork. Arched automates these fatigue checks alongside thousands of other code compliance verifications, letting you explore optimized bridge designs that meet AASHTO requirements while reducing material waste and carbon impact.